Above All Else Show the Data
Best Practices in Data Visualization
2023-05-24
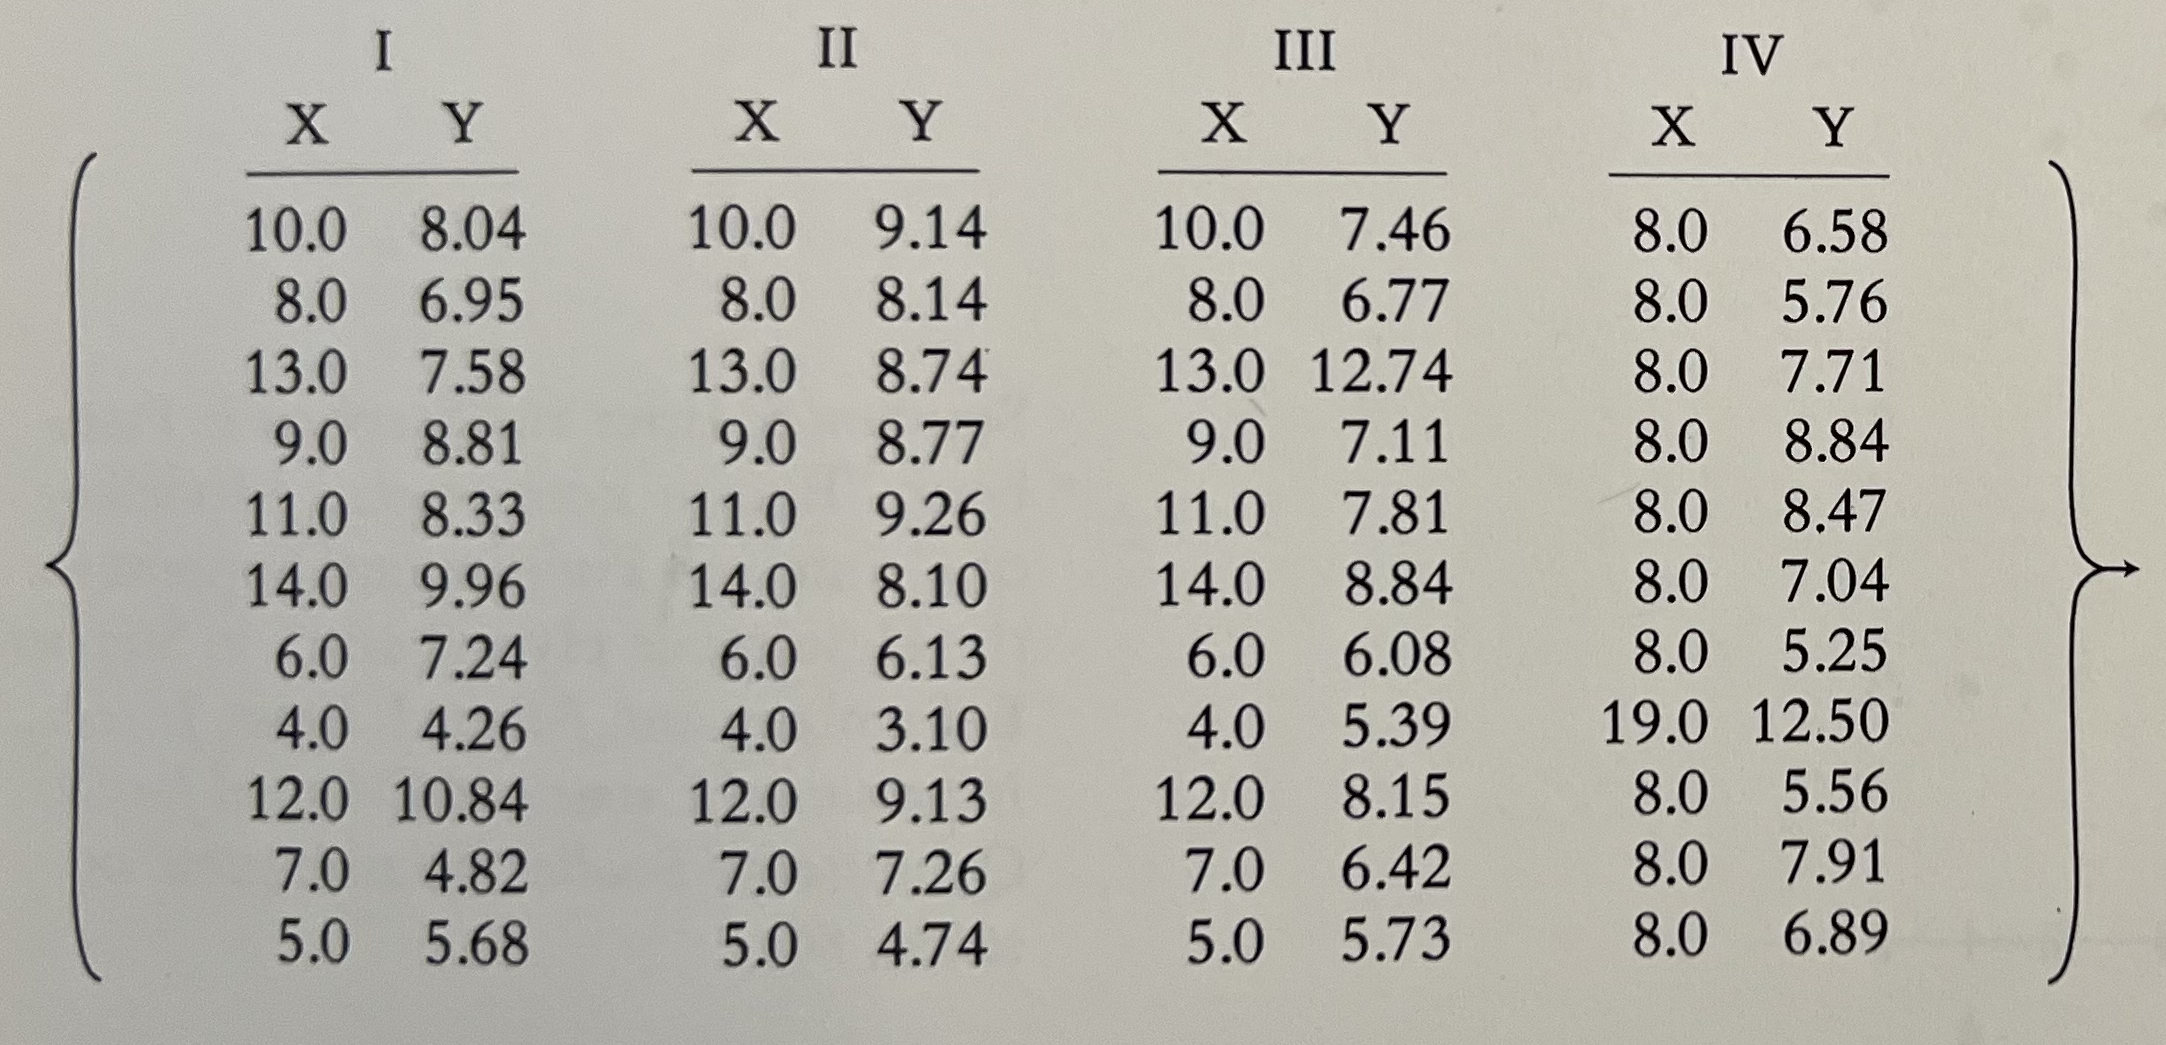
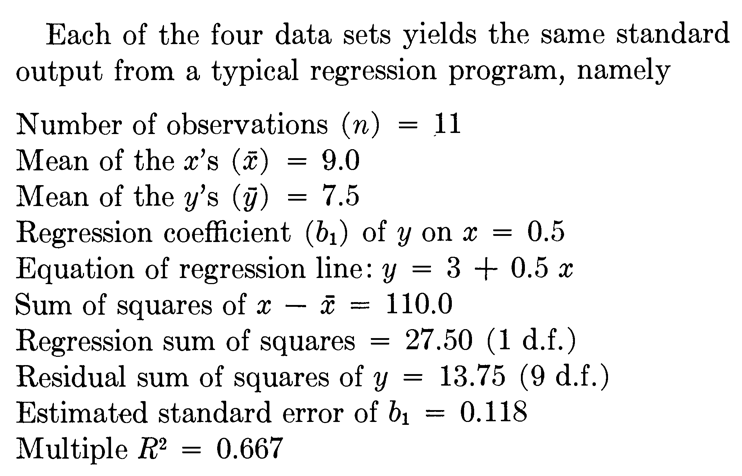
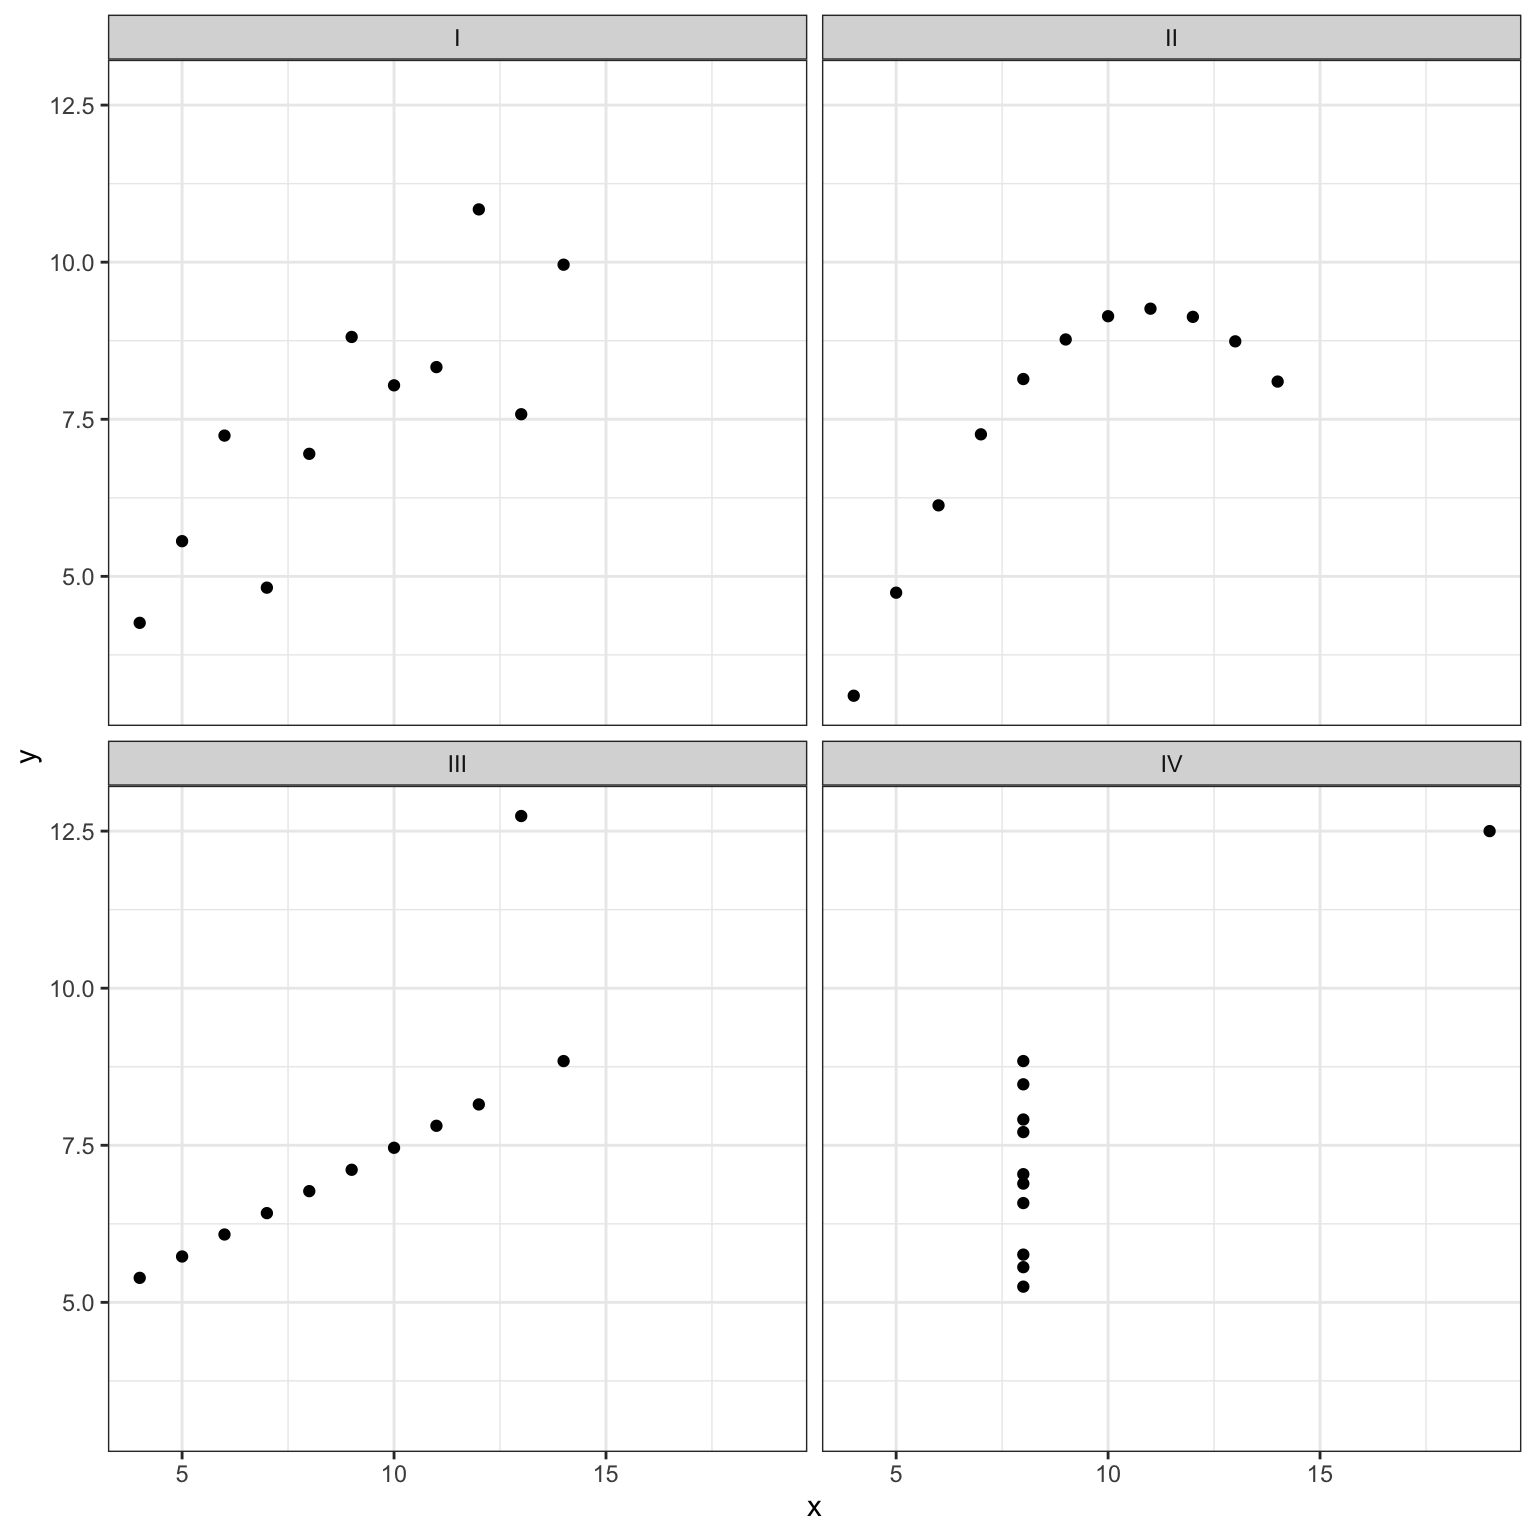
What pattern do you see?
Agenda
- Principles of Graphical Excellence
- Data distortions
- Data-ink
- Identify graphic crimes
- The importance of color
- Socially responsible visualizations
- Resources
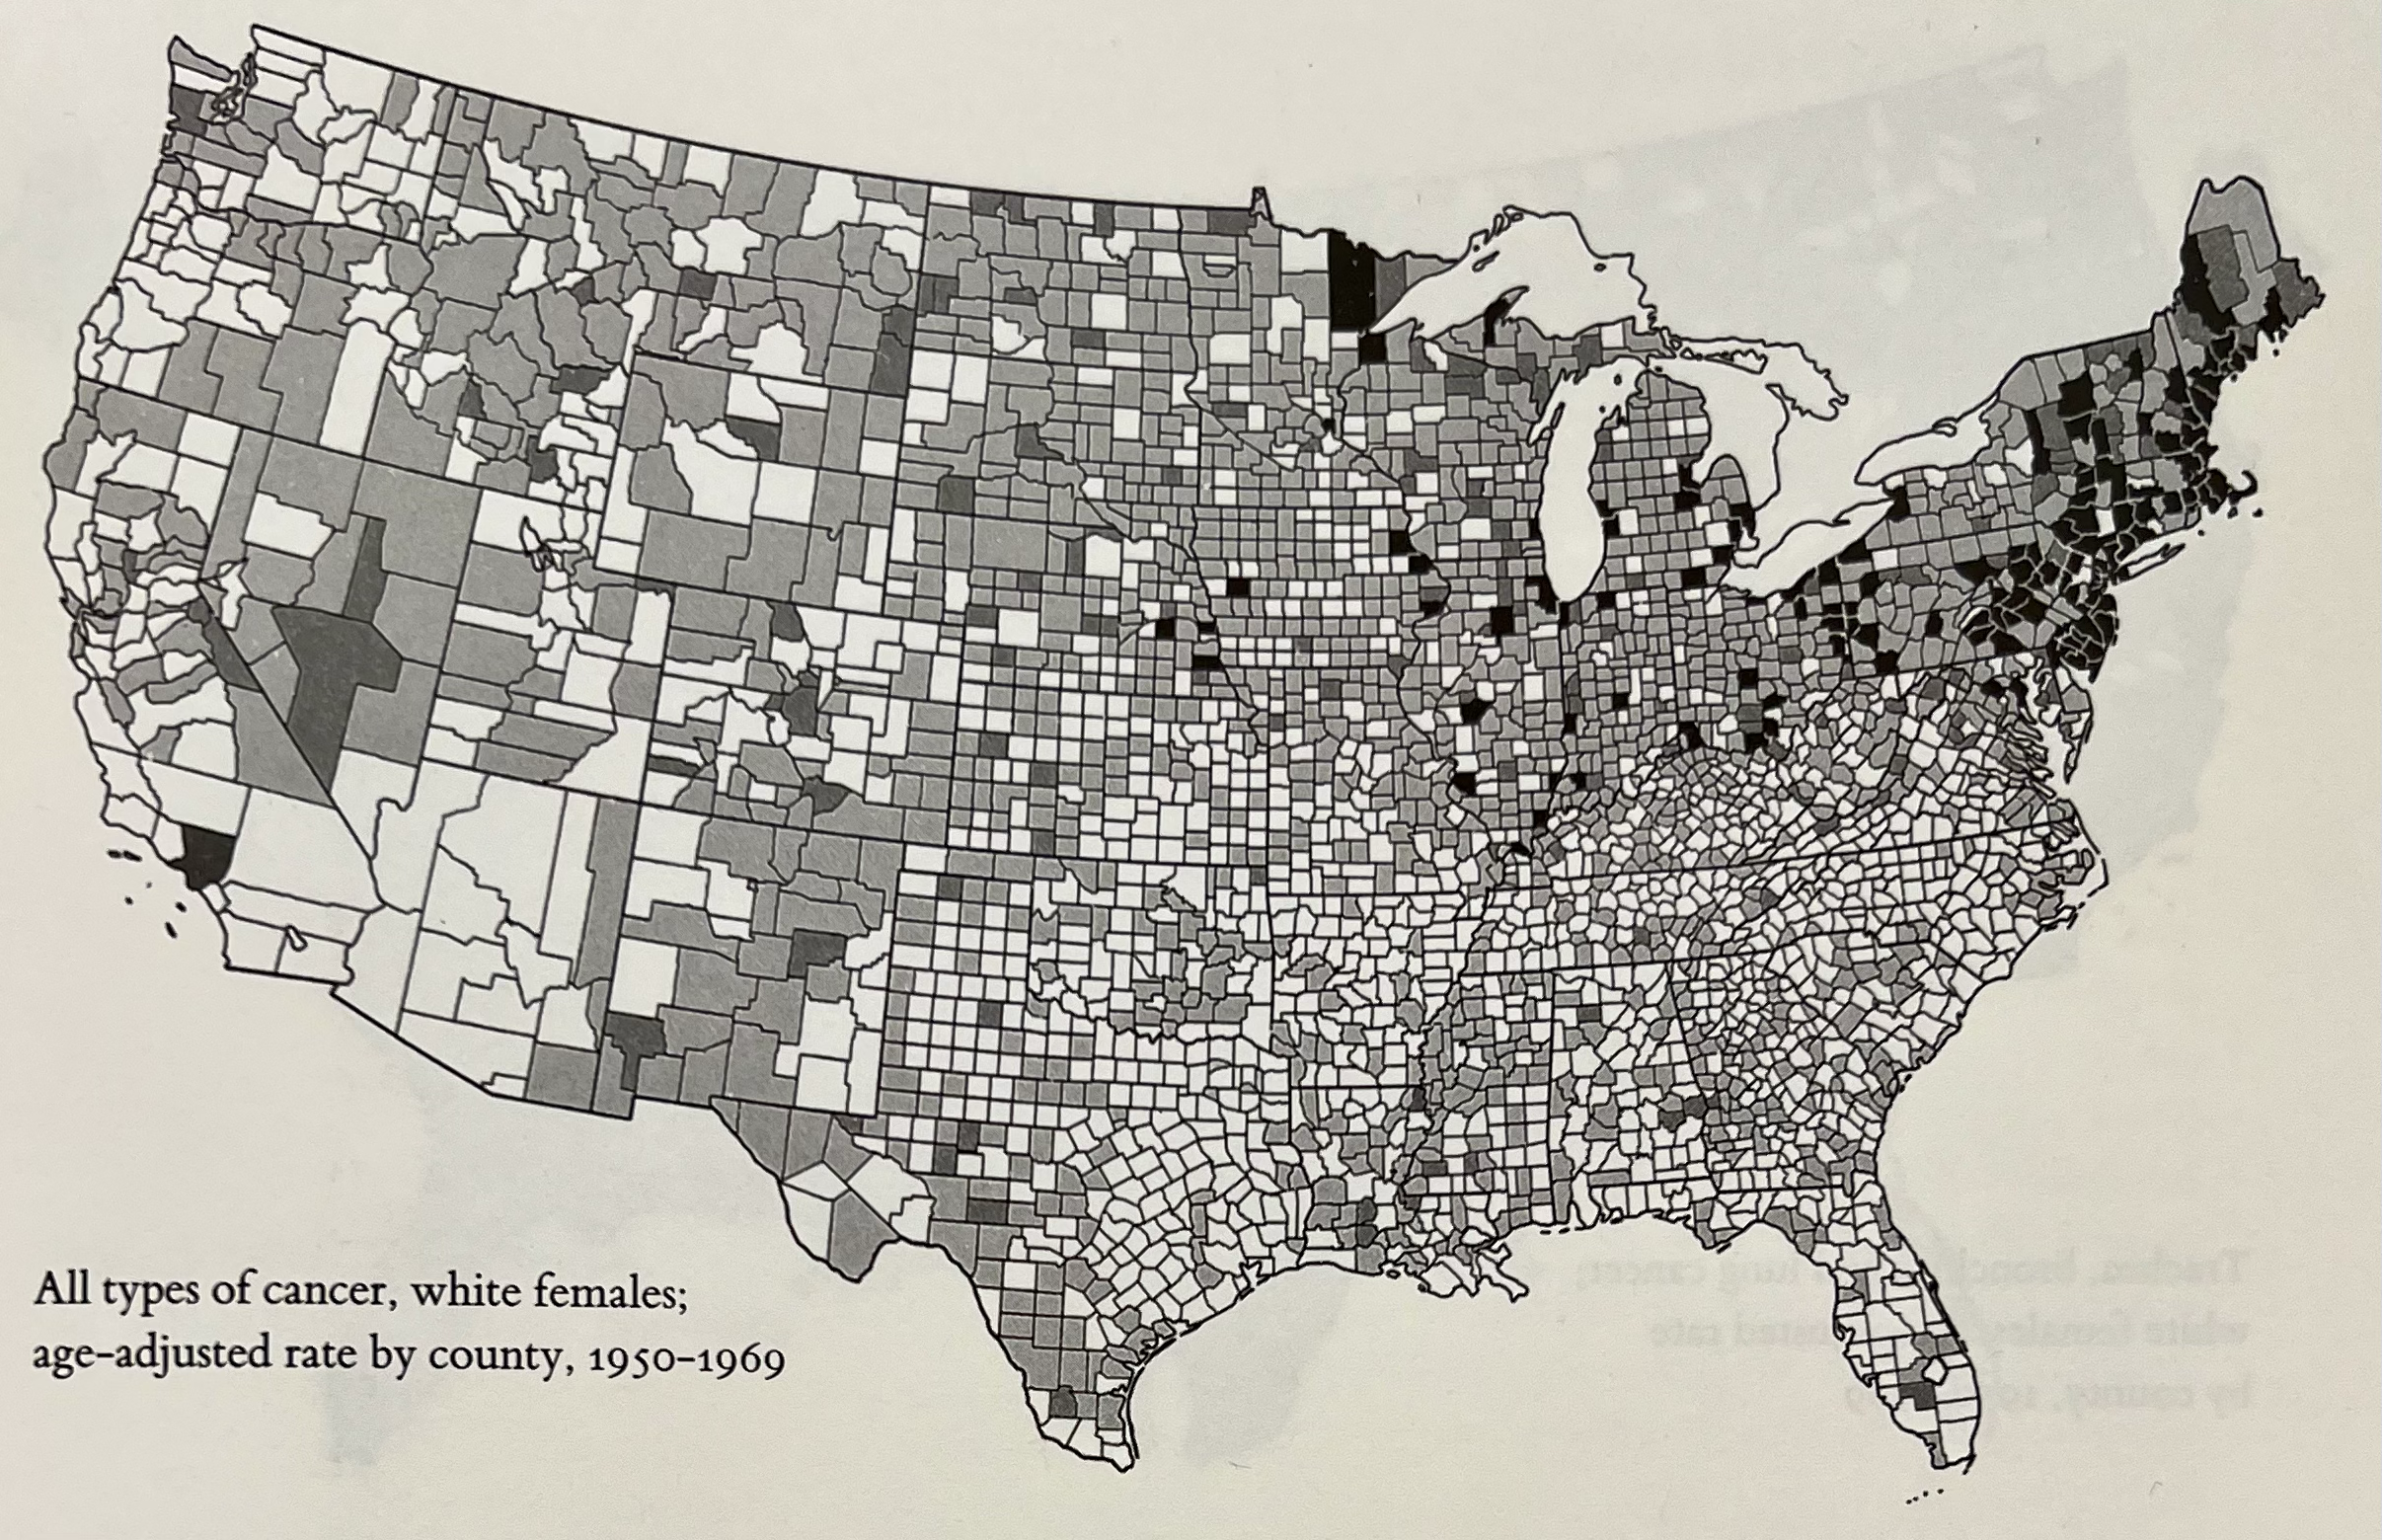
Data Maps: Death Rates from Cancer, Female
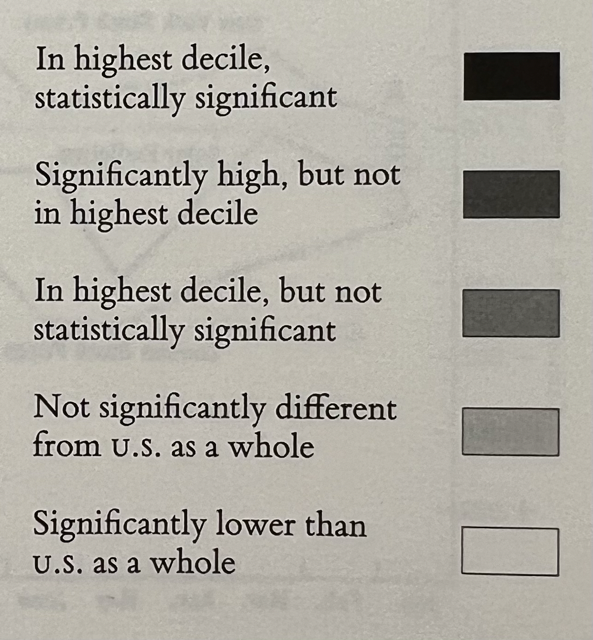
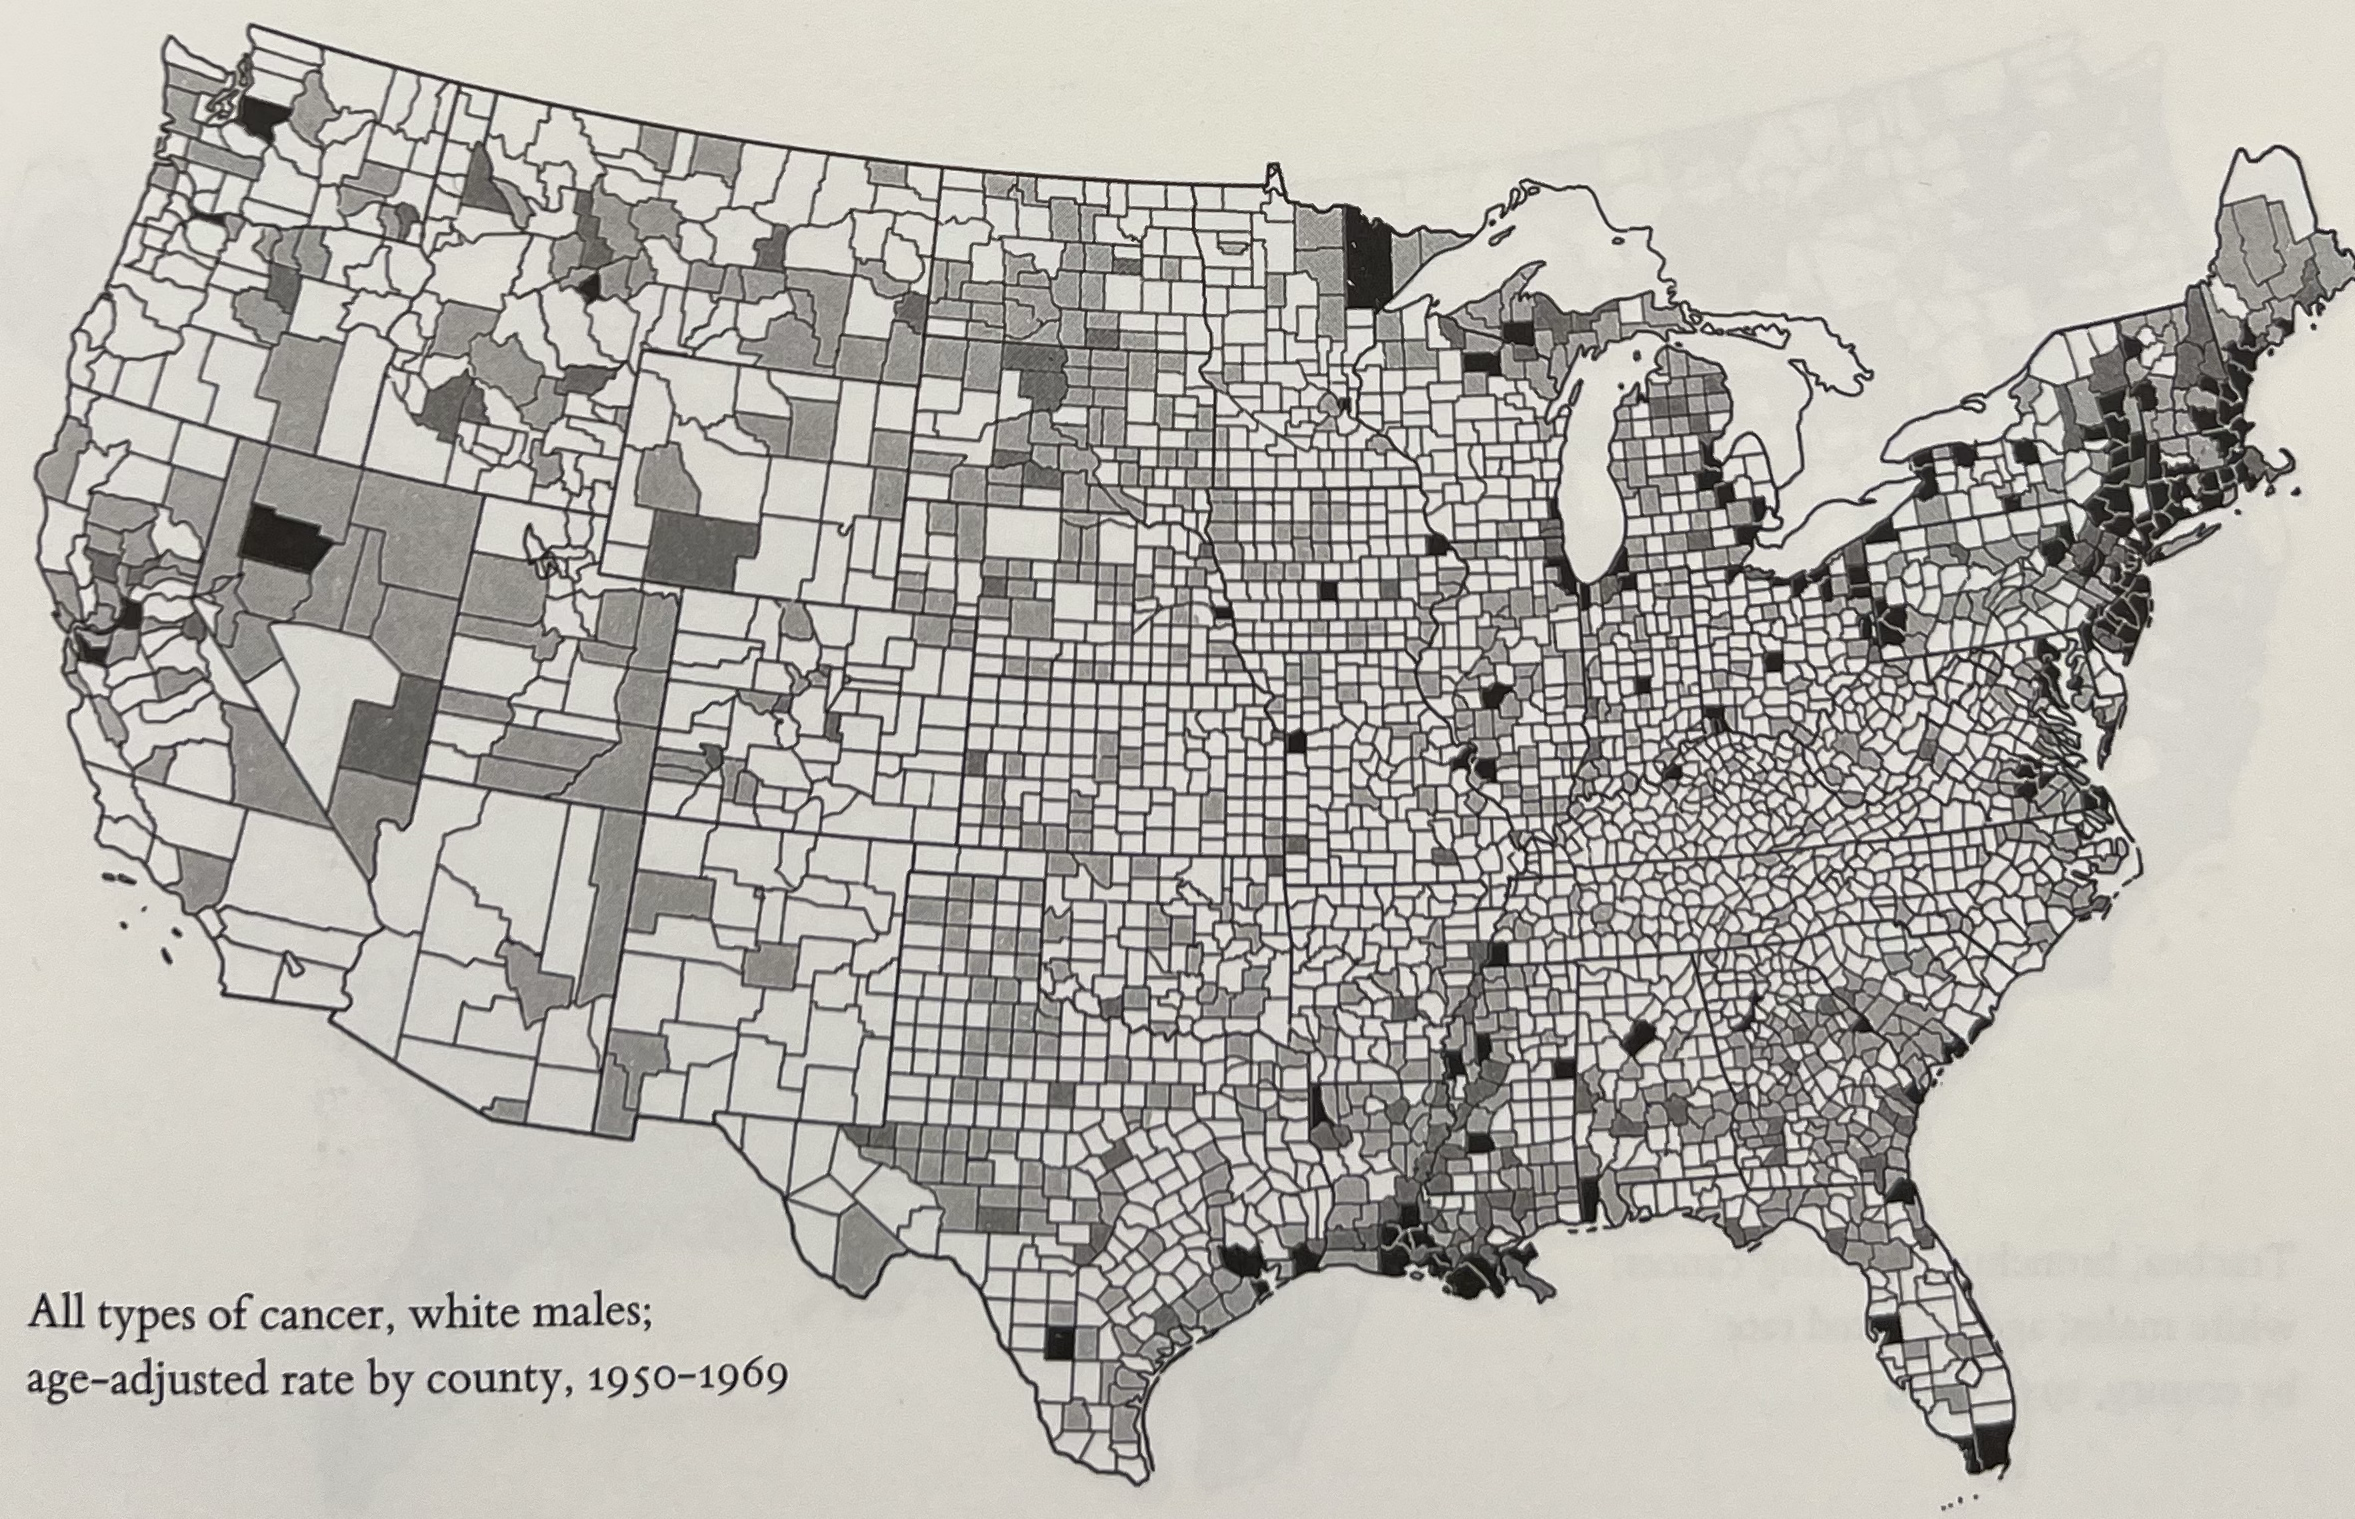
Data Maps: Death Rates from Cancer, Male
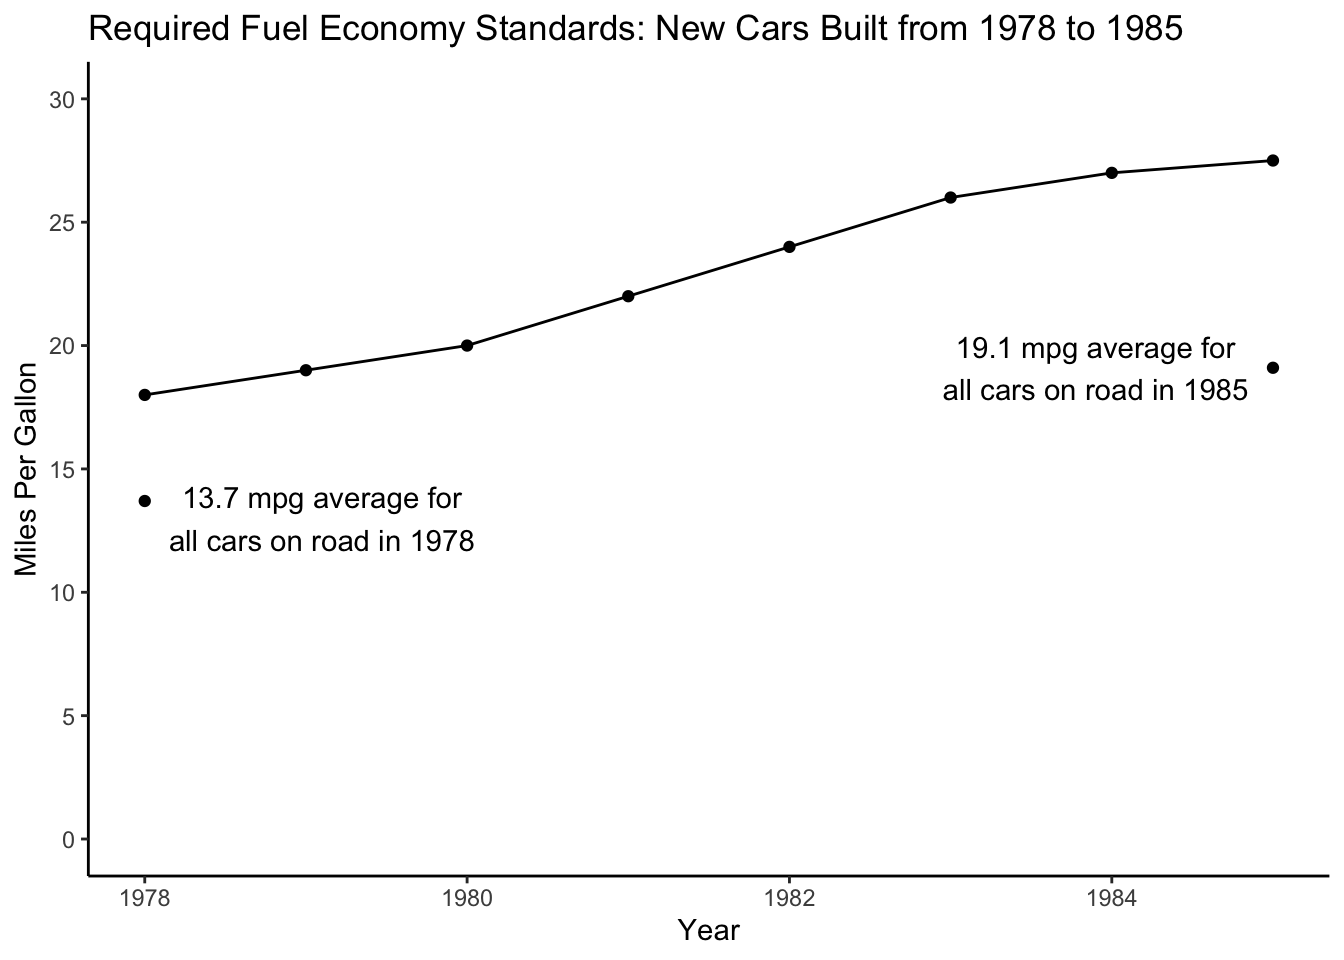
Fuel Economy Standards
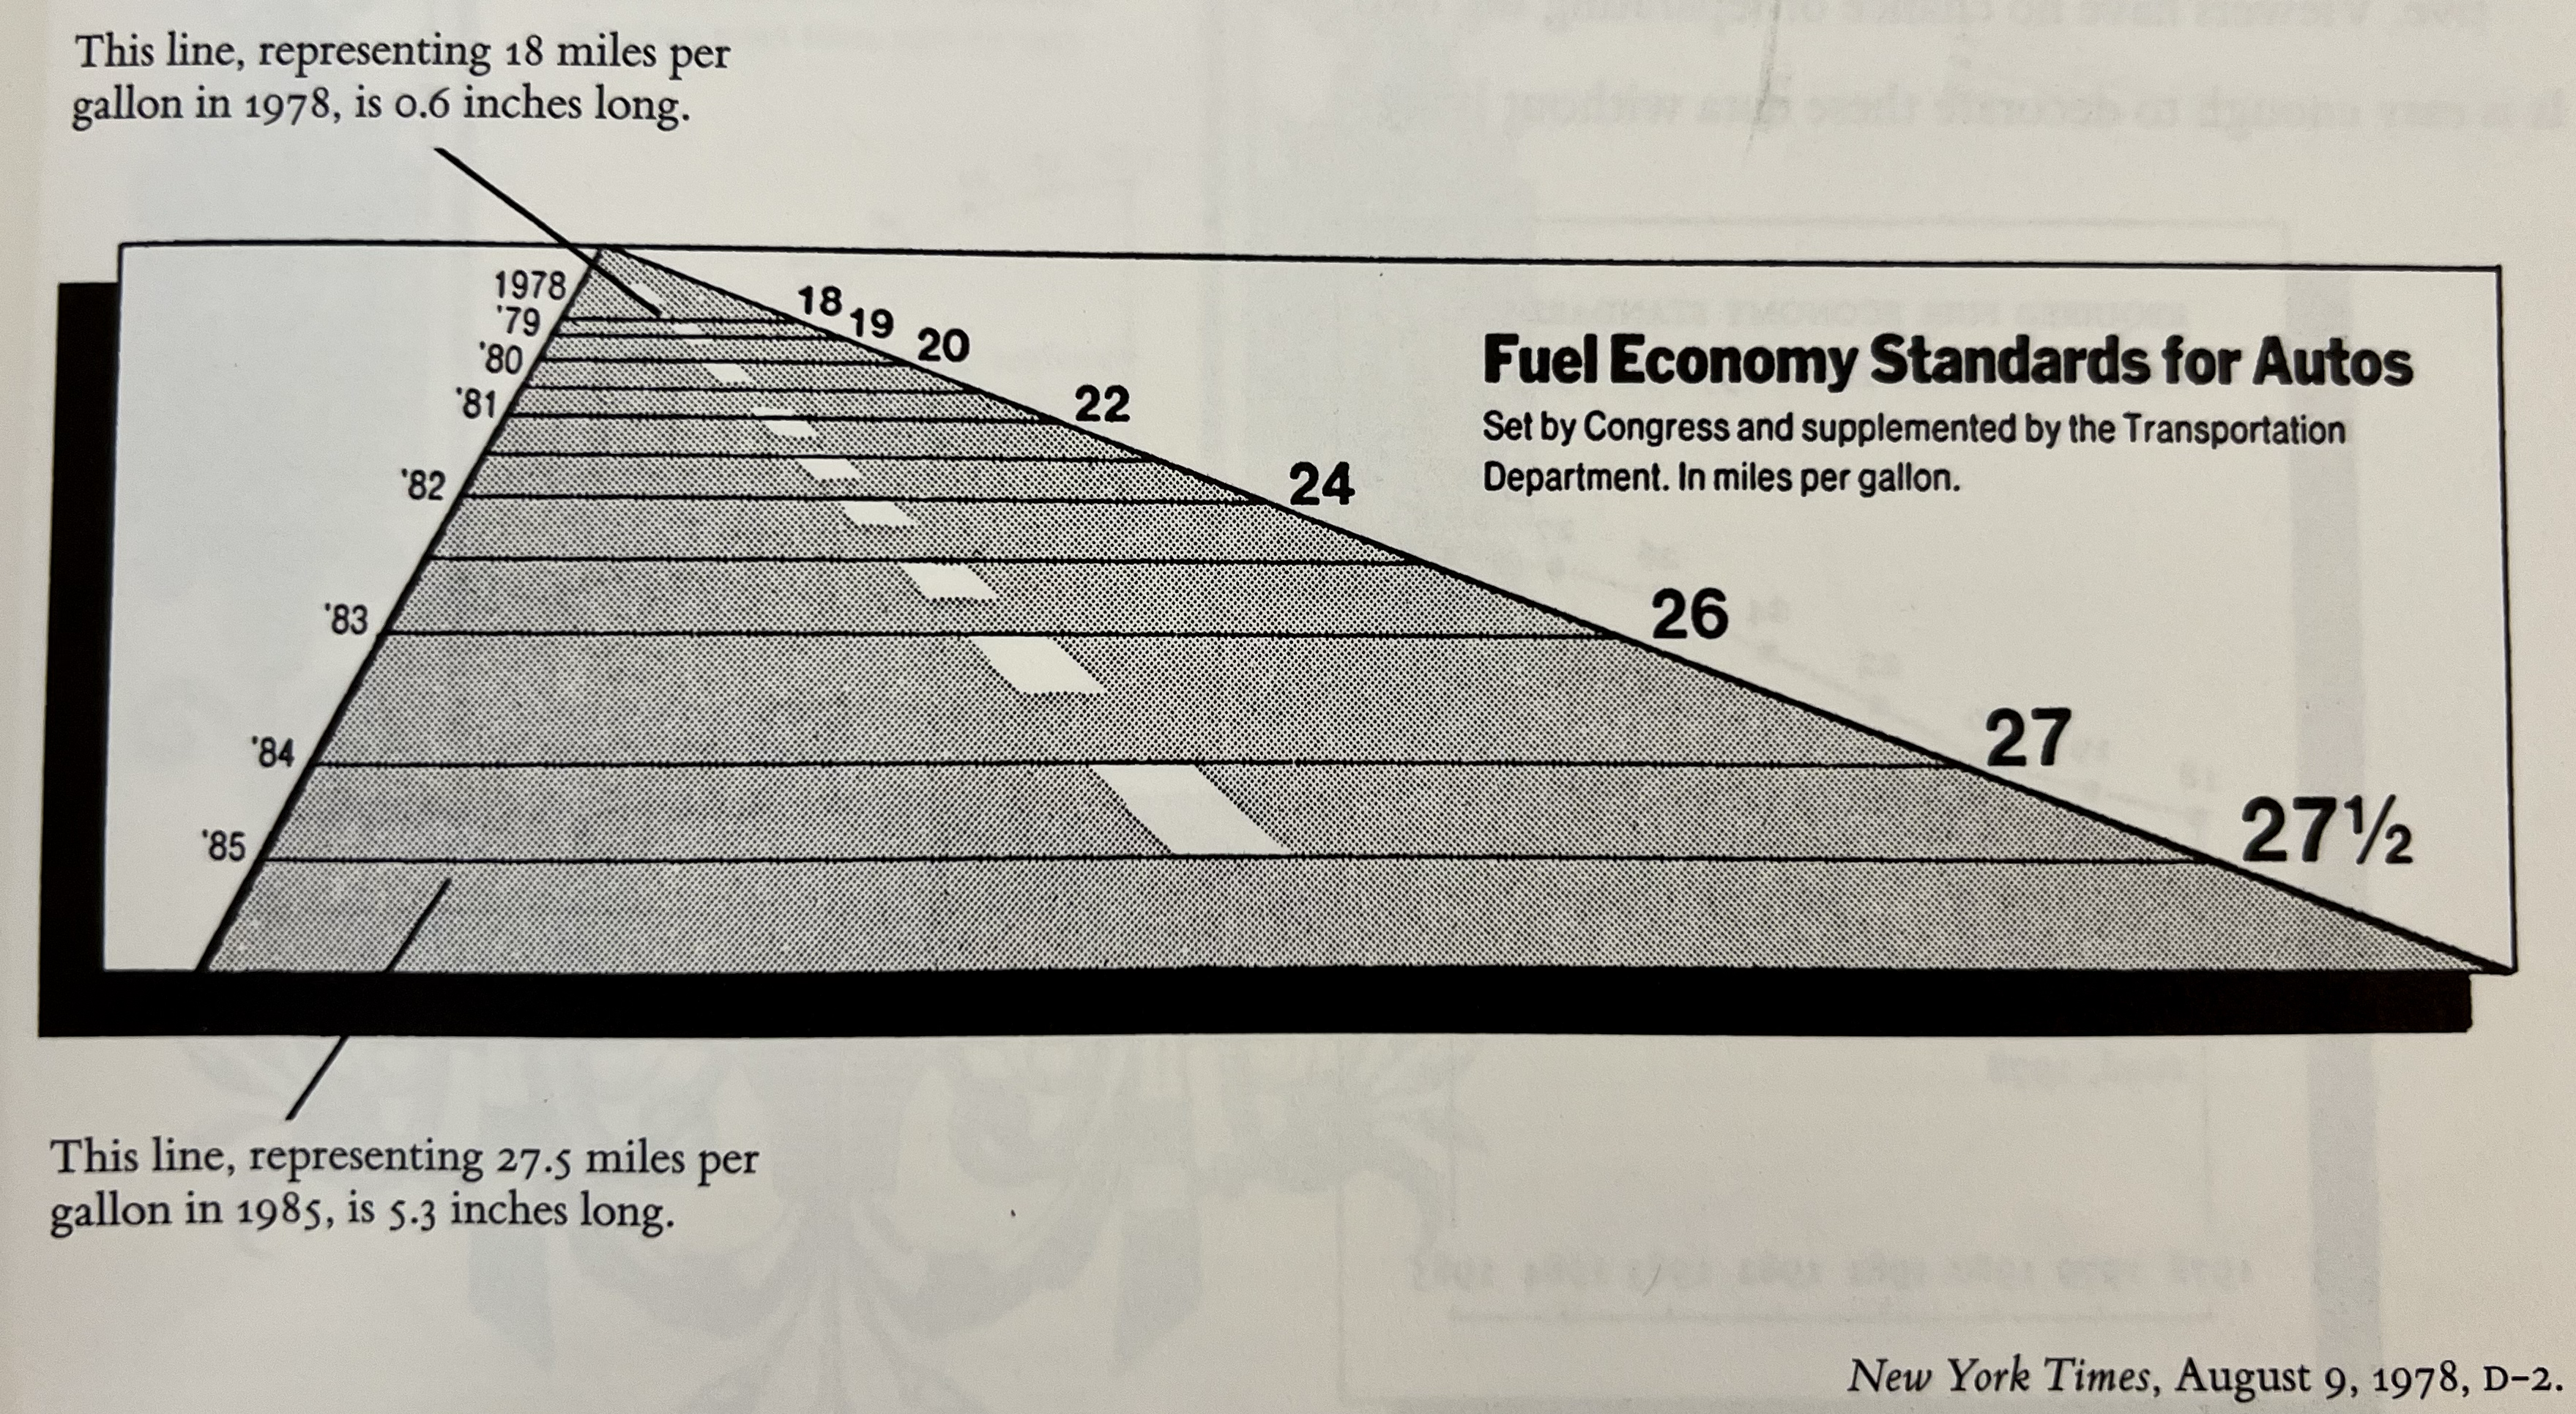
Fuel Economy Standards
\[ \frac{27.5-18.0}{18.0} \times 100=53\% \]
\[ \frac{5.3-0.6}{0.6} \times 100=783\% \]
Fuel Economy Clarified

Data-Ink
A large share of ink on a graphic should present data-information
Data ink is the non-erasable core of a graphic arranged in response to variation in the numbers represented
Every bit of ink on a graphic requires a reason - and that reason is to present new information
![]()

Erase non-data-ink
What elements of this chart are not data-ink?

Erase non-data-ink
The grid lines!
Erase non-data-ink
Erase non-data-ink
Erase non-data-ink
Pie Charts
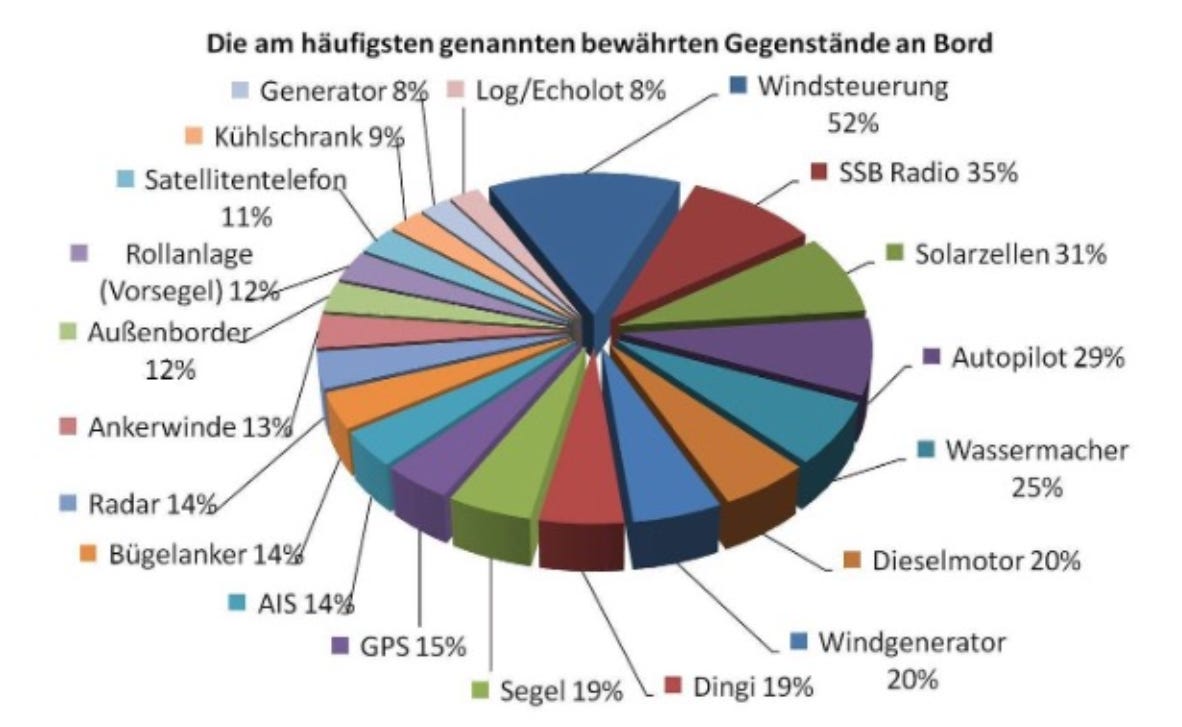
The Pie Proof1
What is the pattern here?
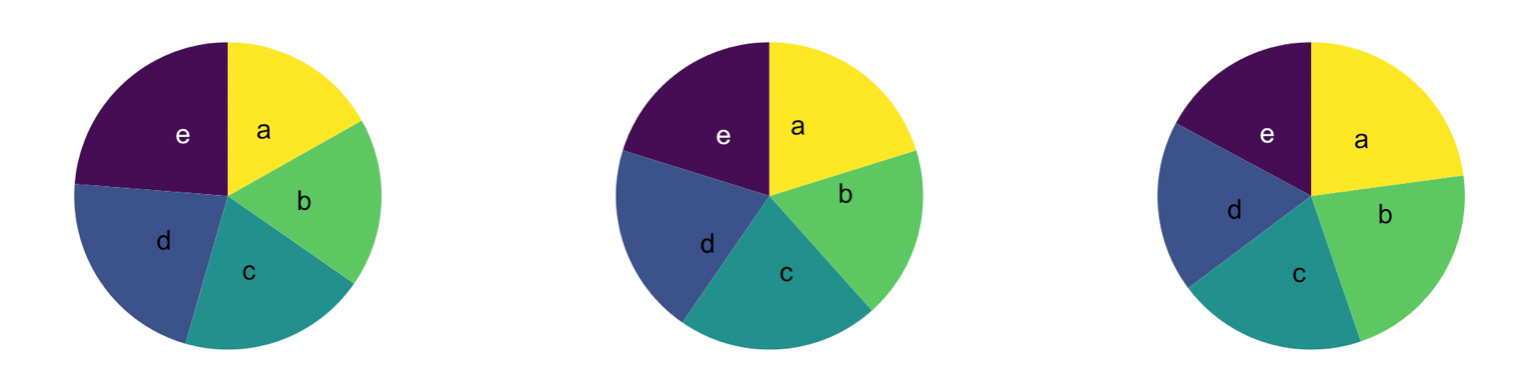
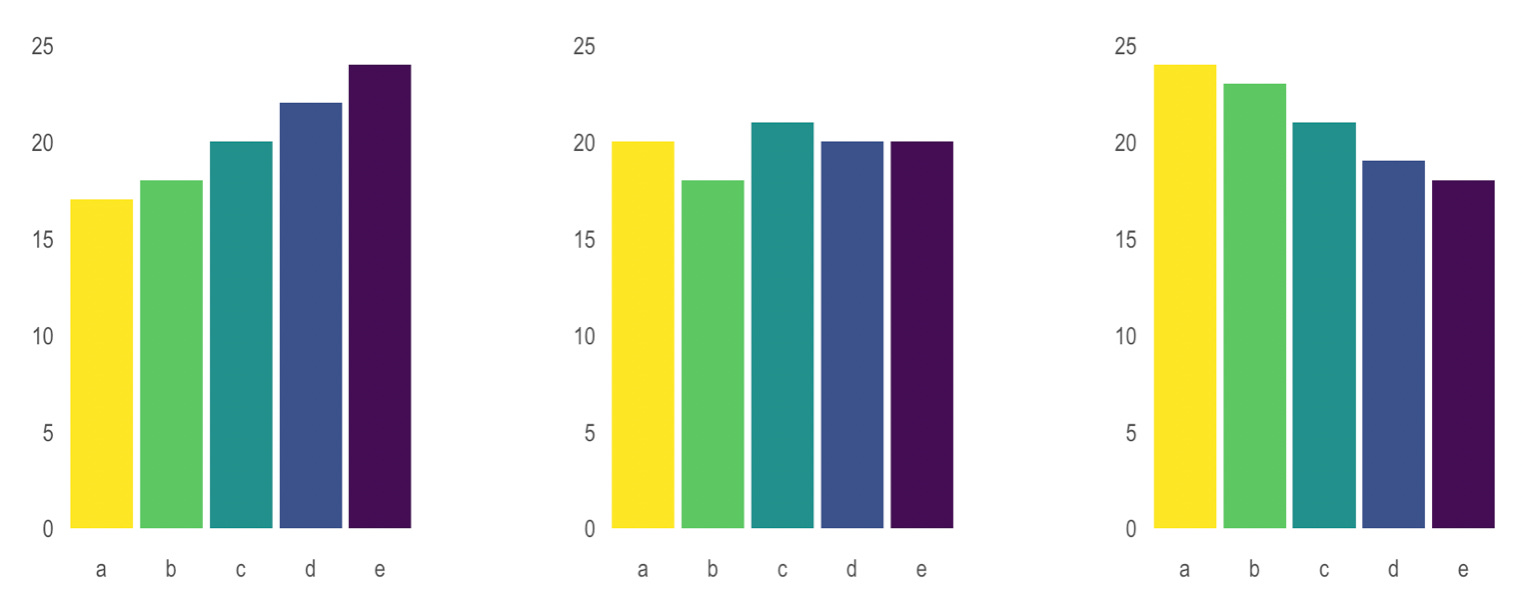
Can you see the pattern now?
What’s wrong with this visualization?

What’s wrong with this visualization?

What’s wrong with this visualization?

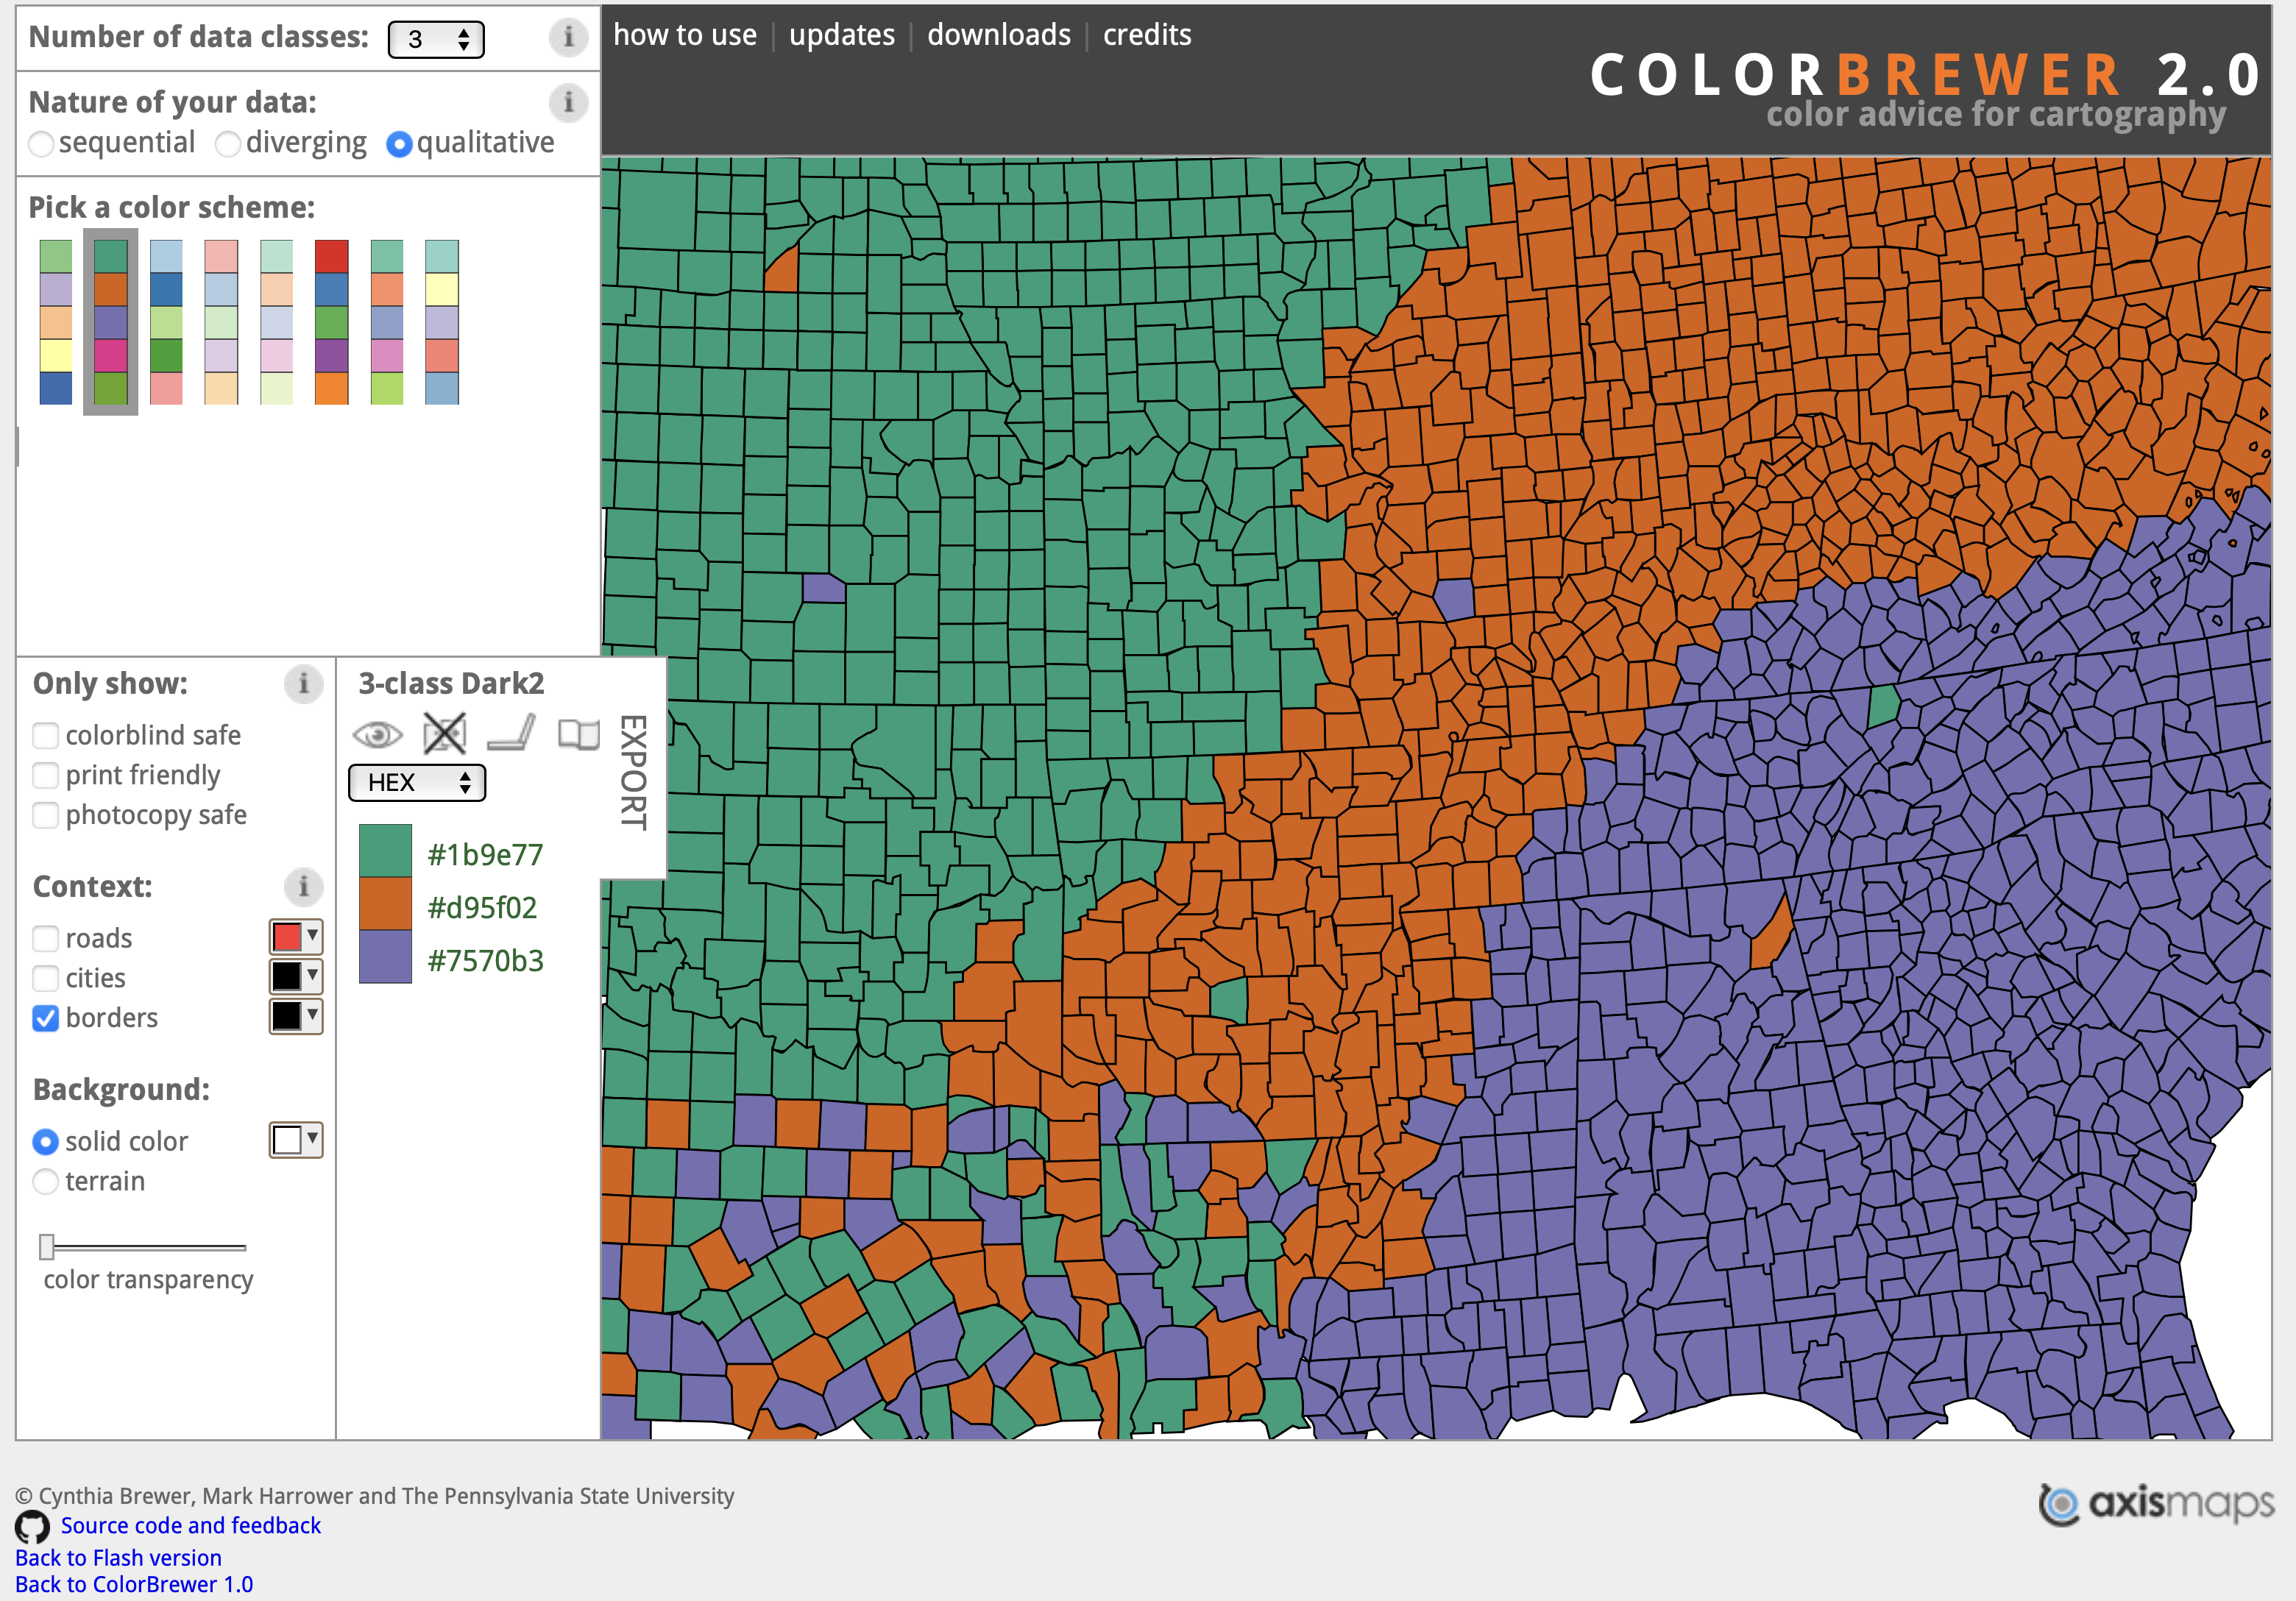
Qualitative1
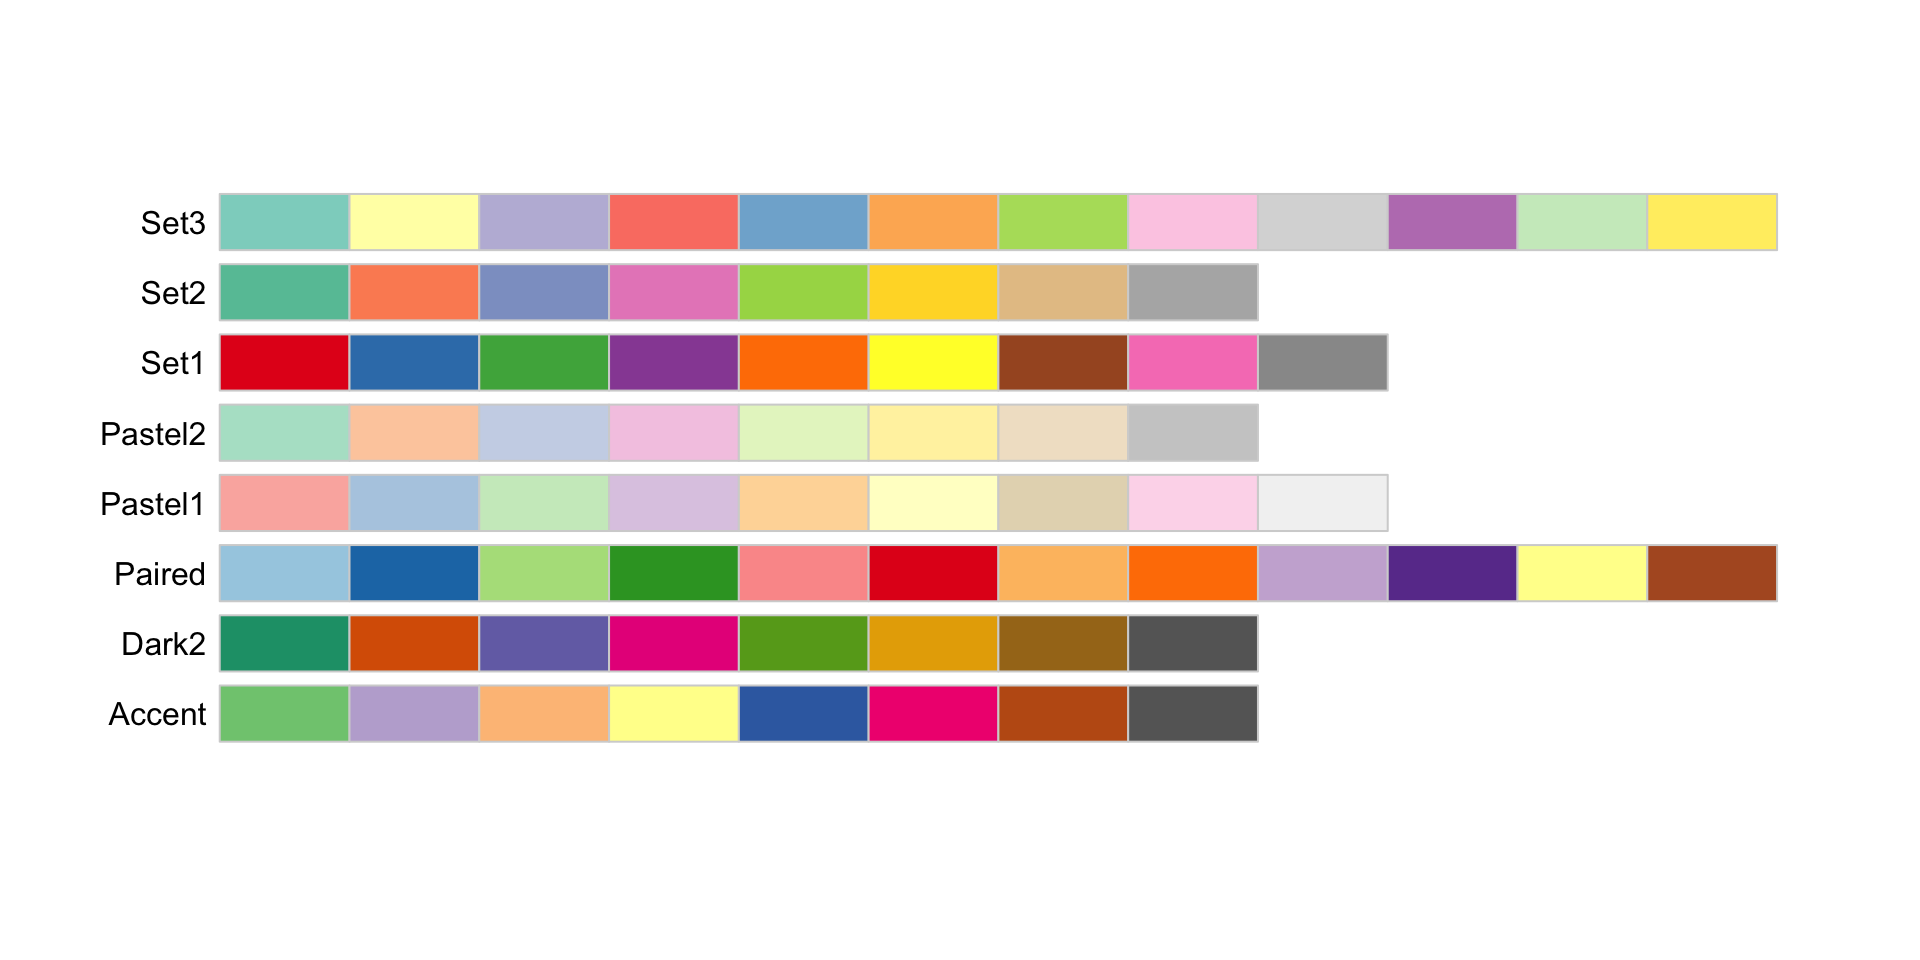
Sequential
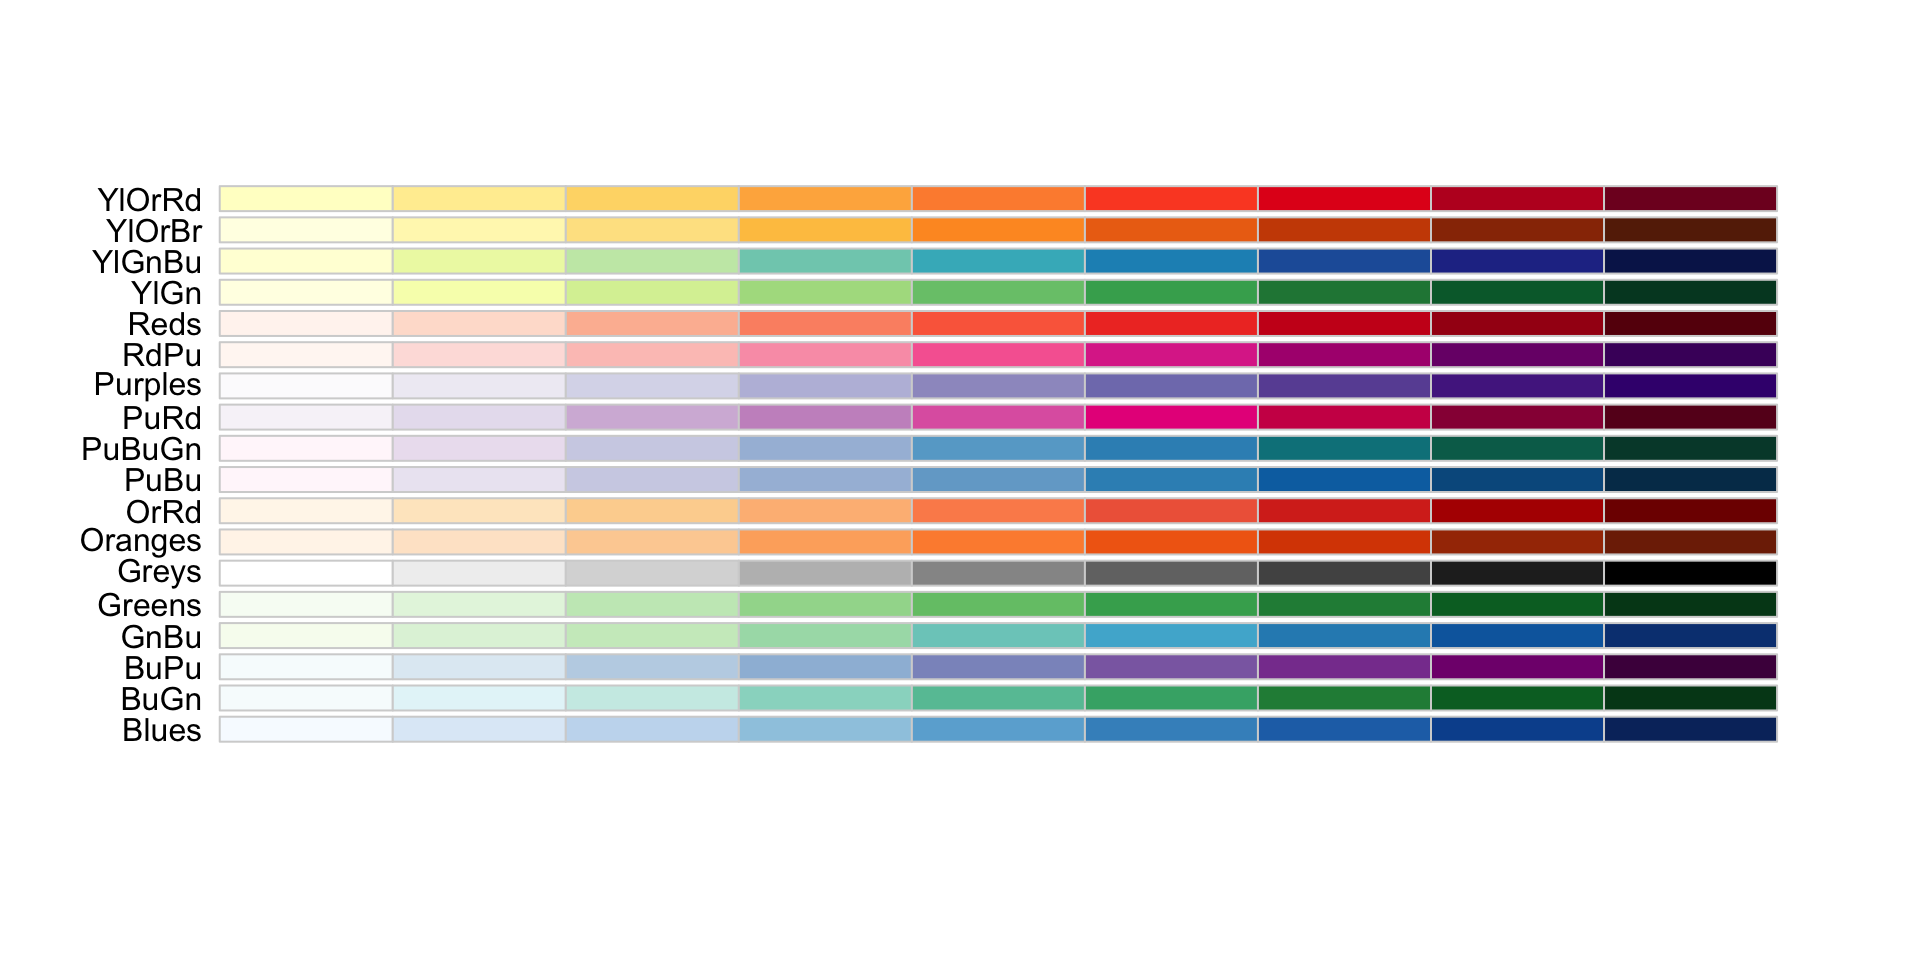
Diverging
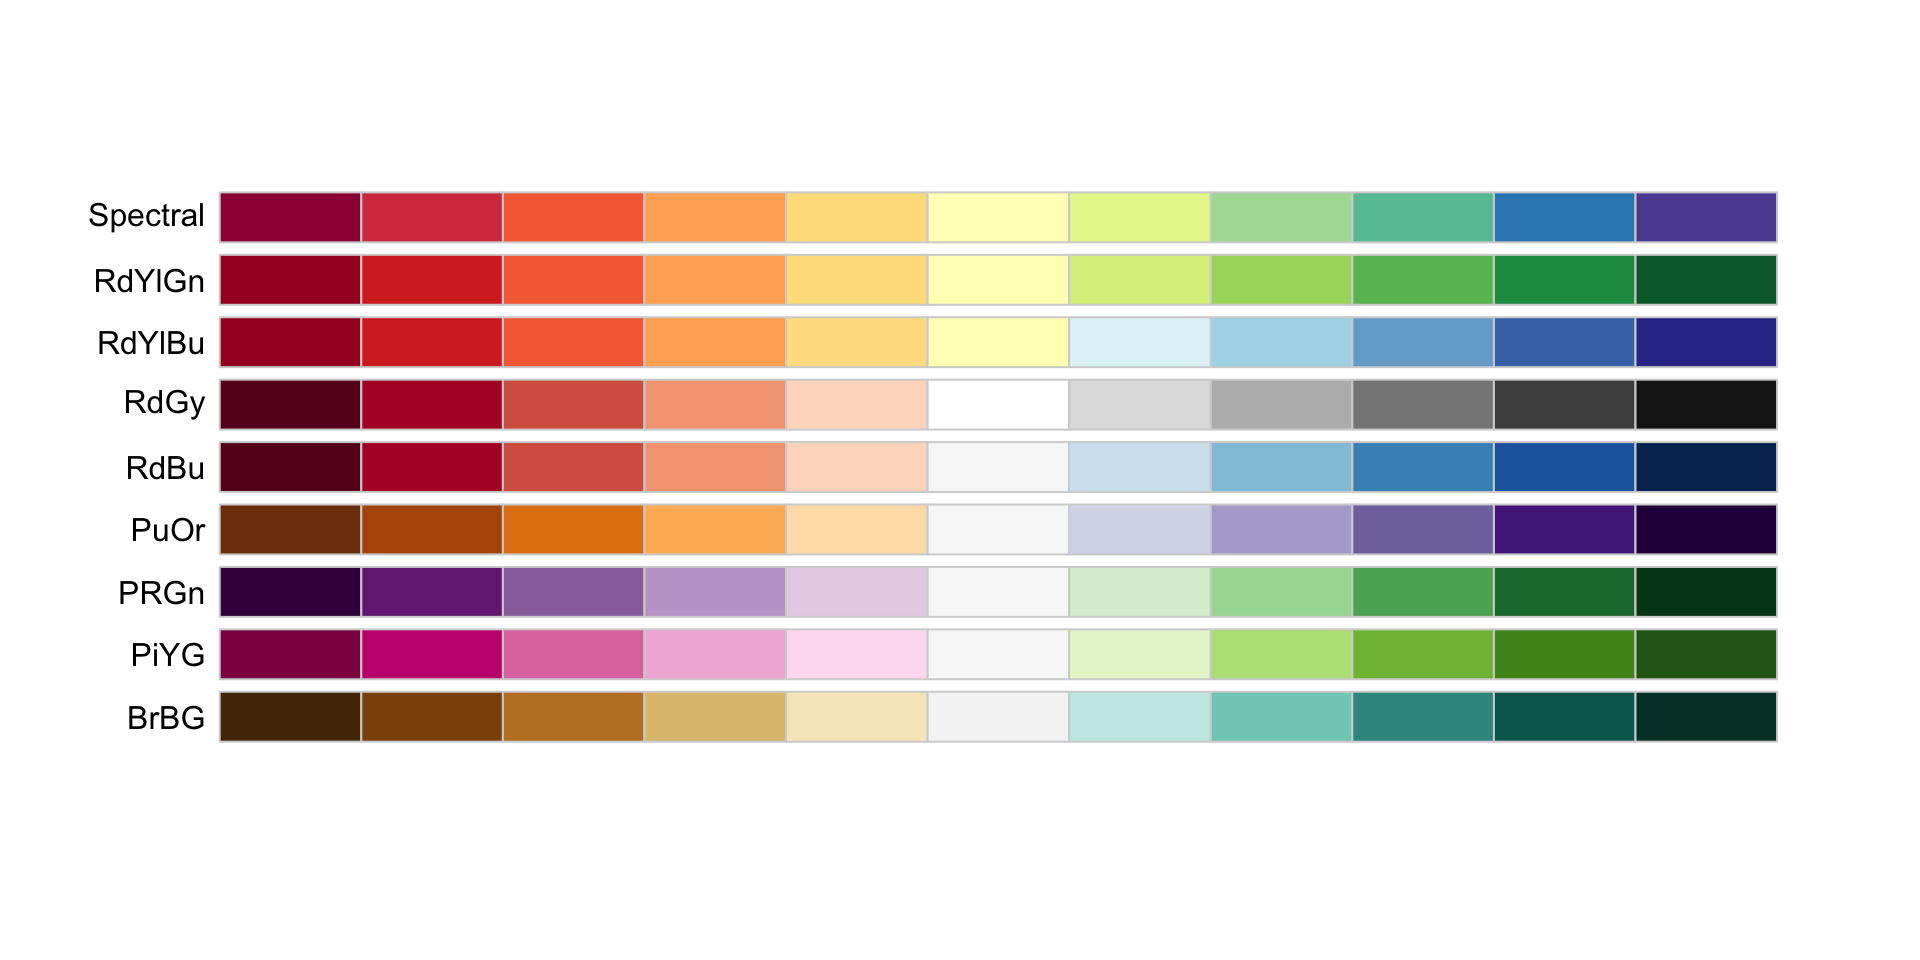
Color Brewer
Improving graphics with/out color1
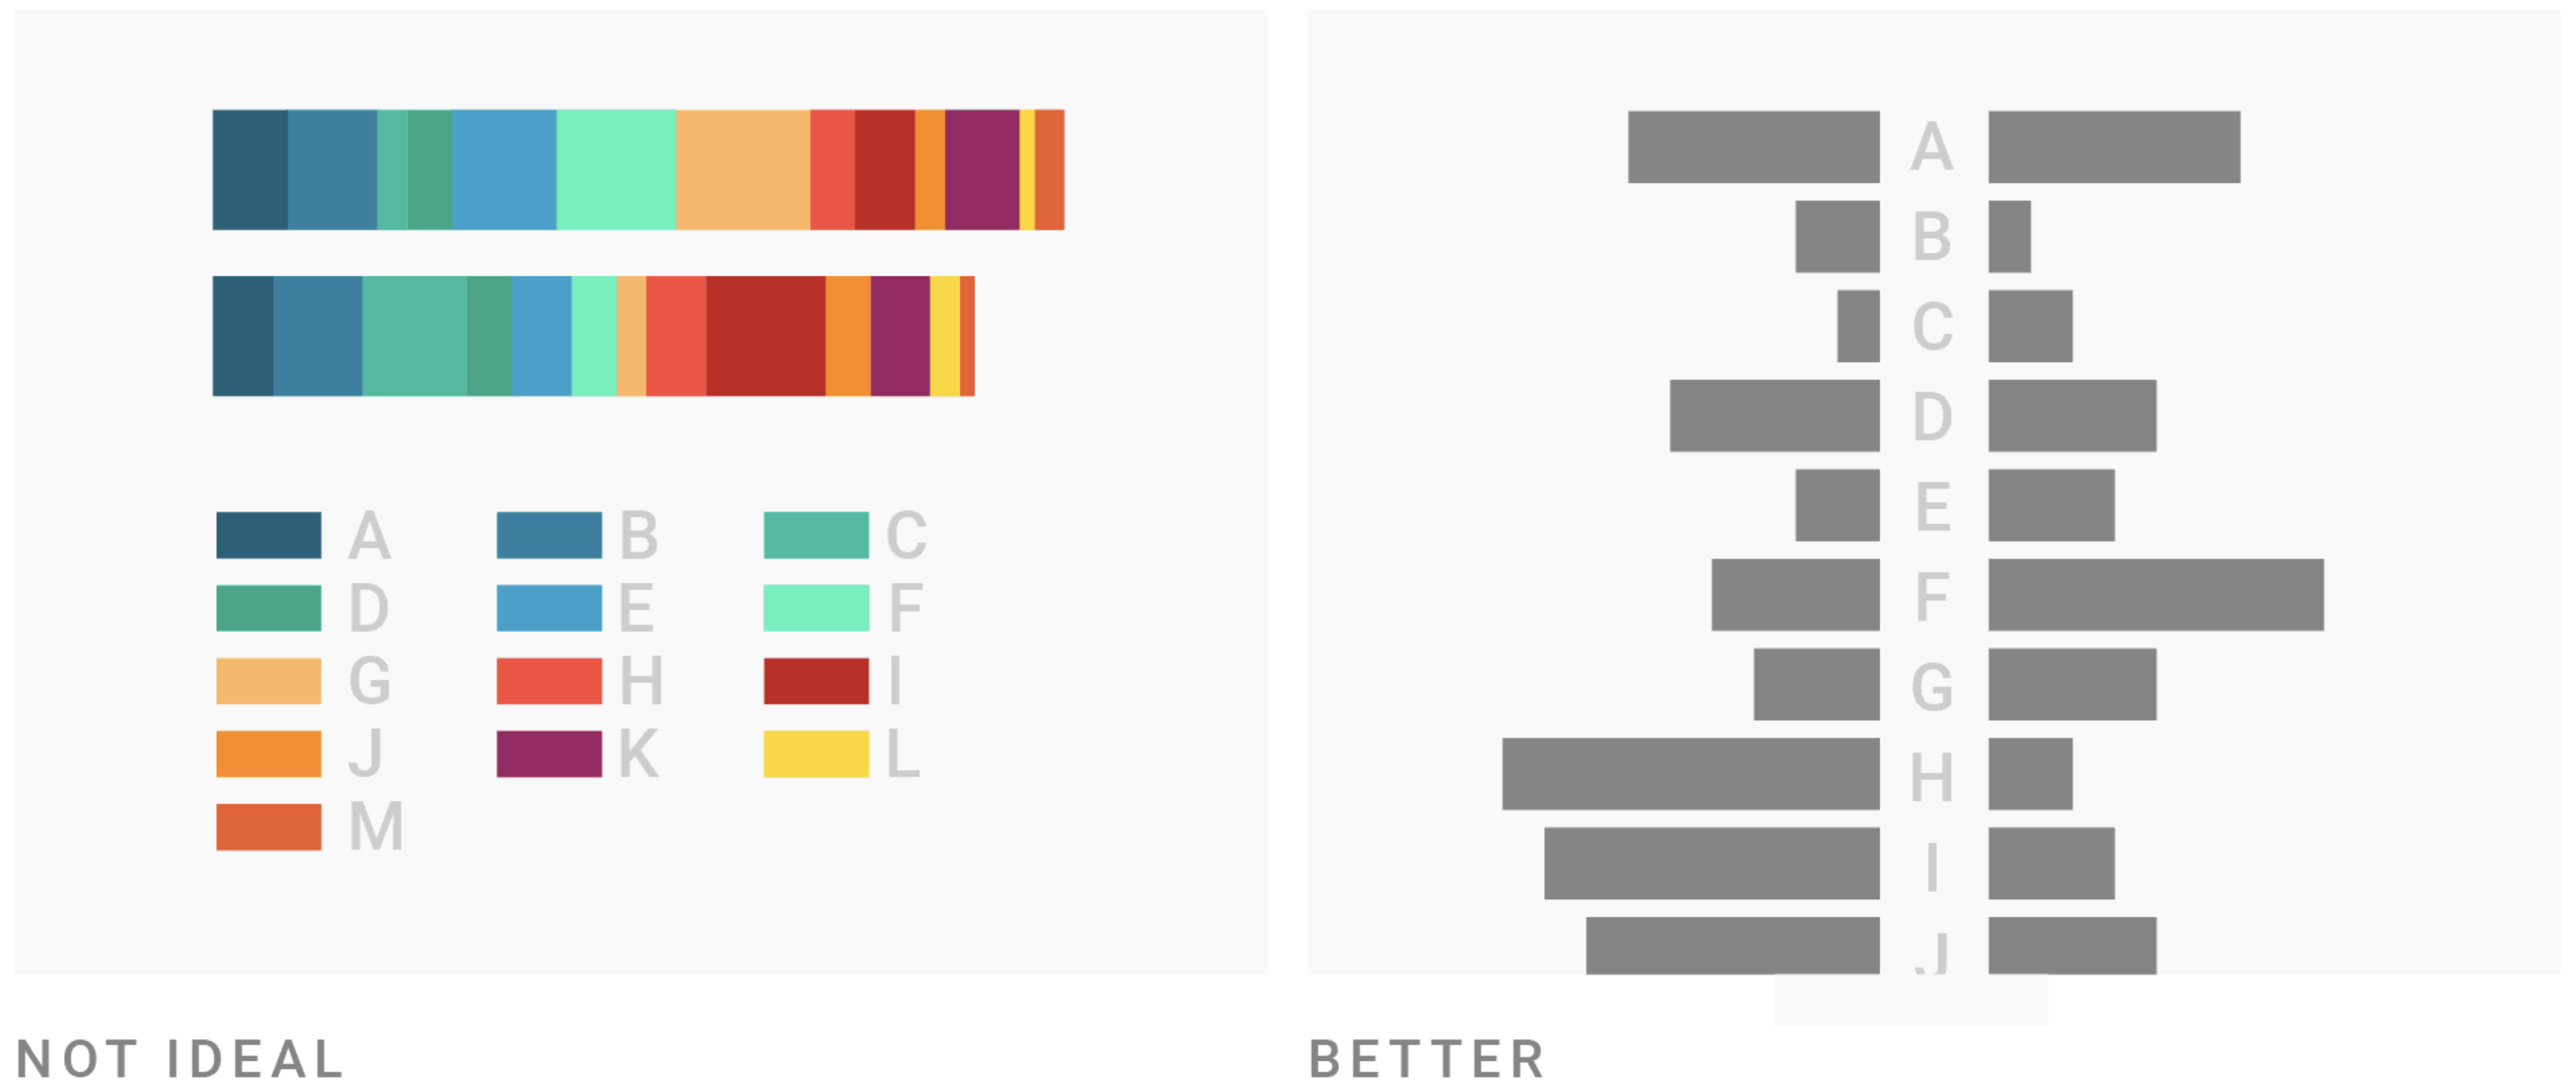
Move color mapping to bar height
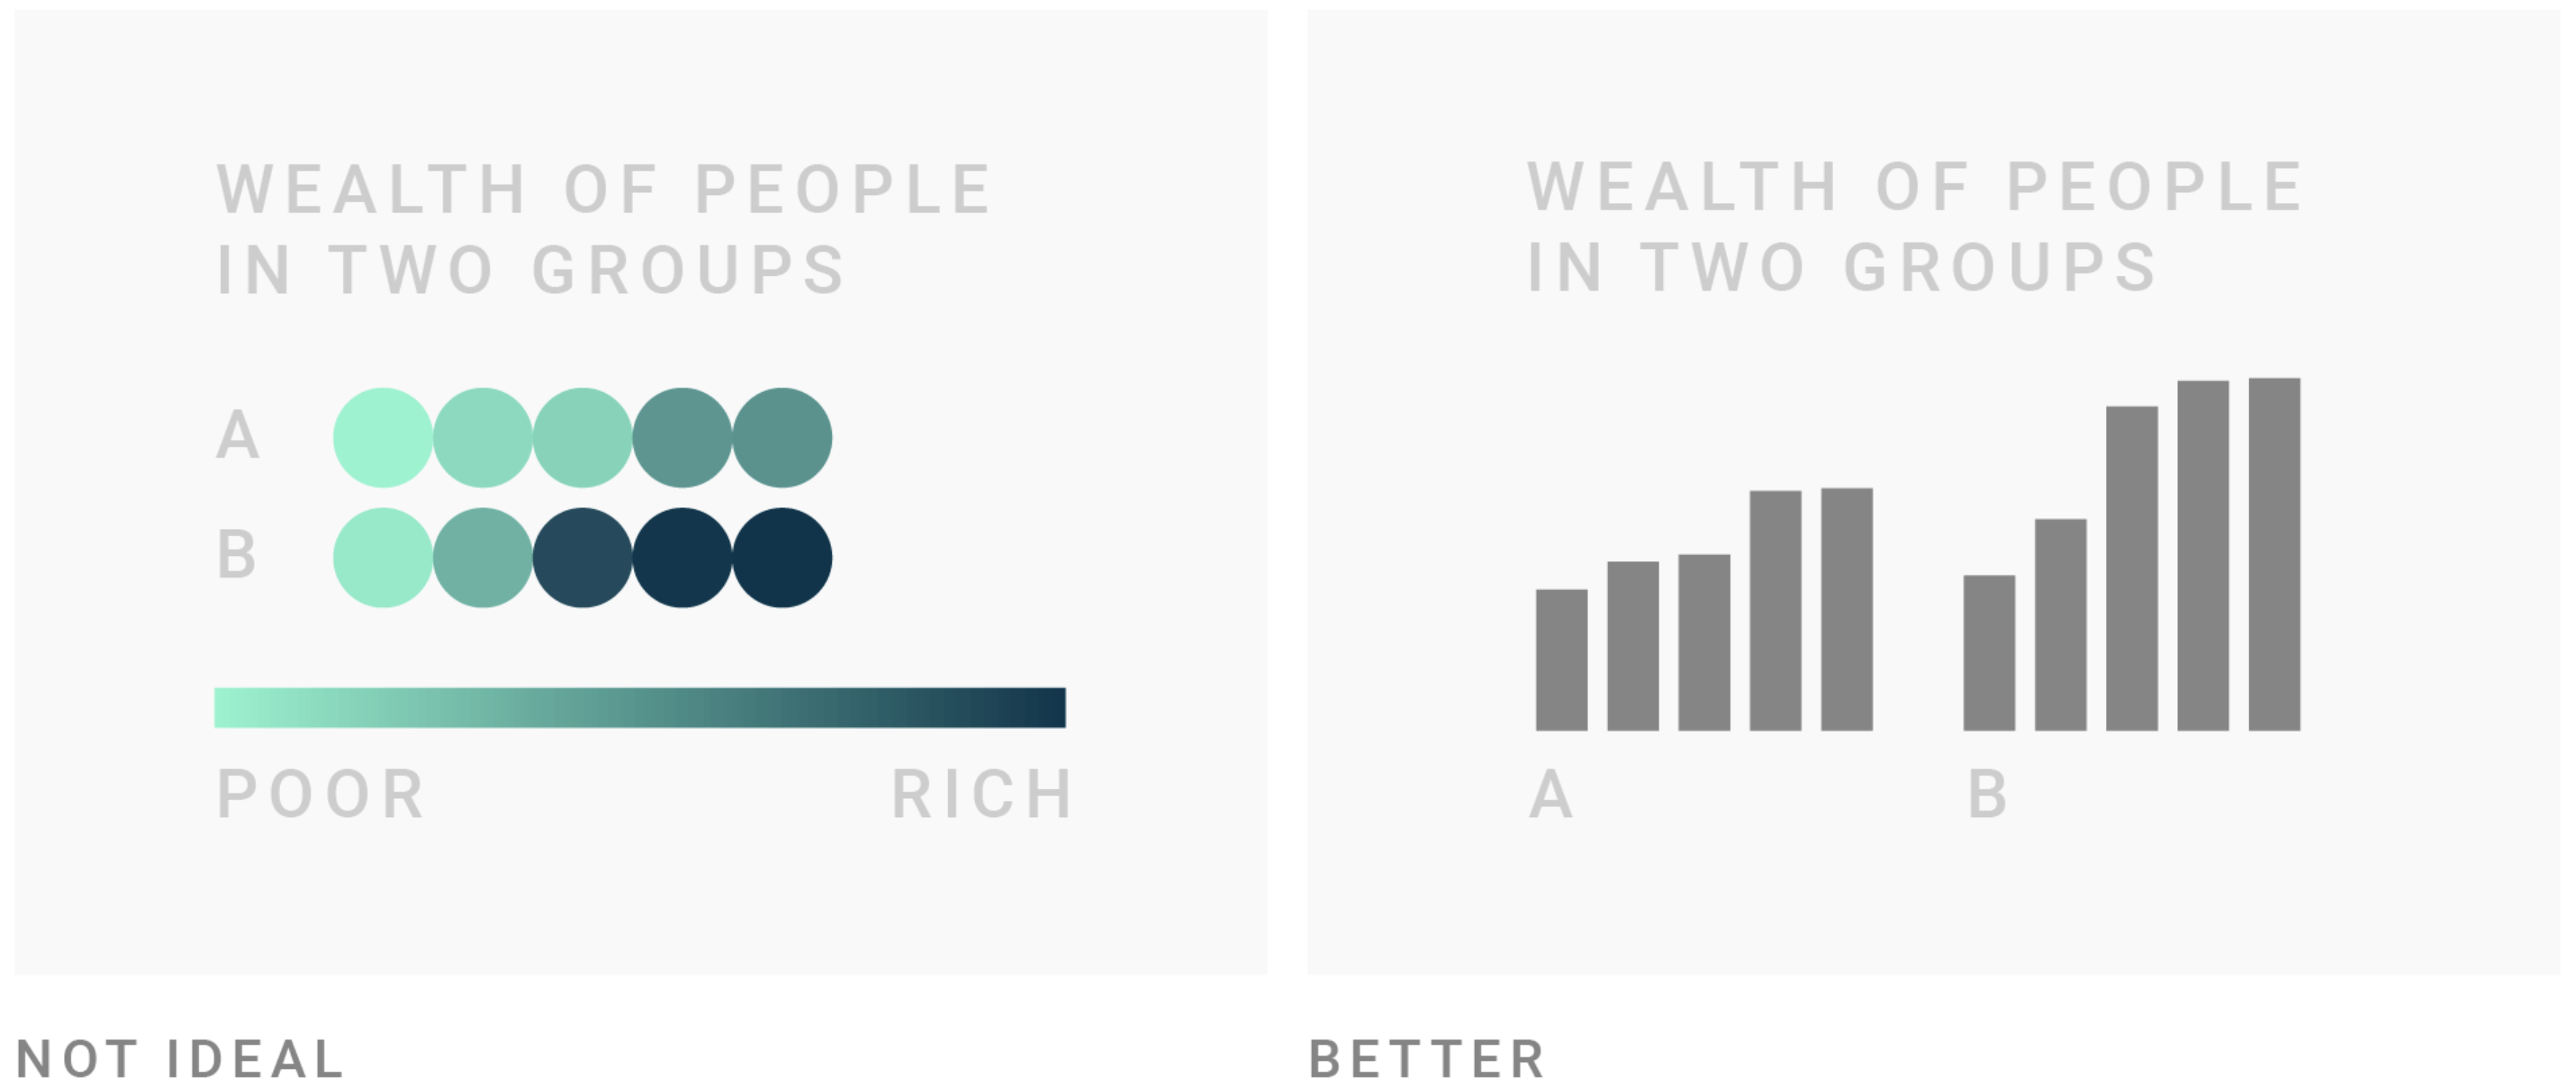
Improving graphics with/out color
Move color mapping to bar height and position
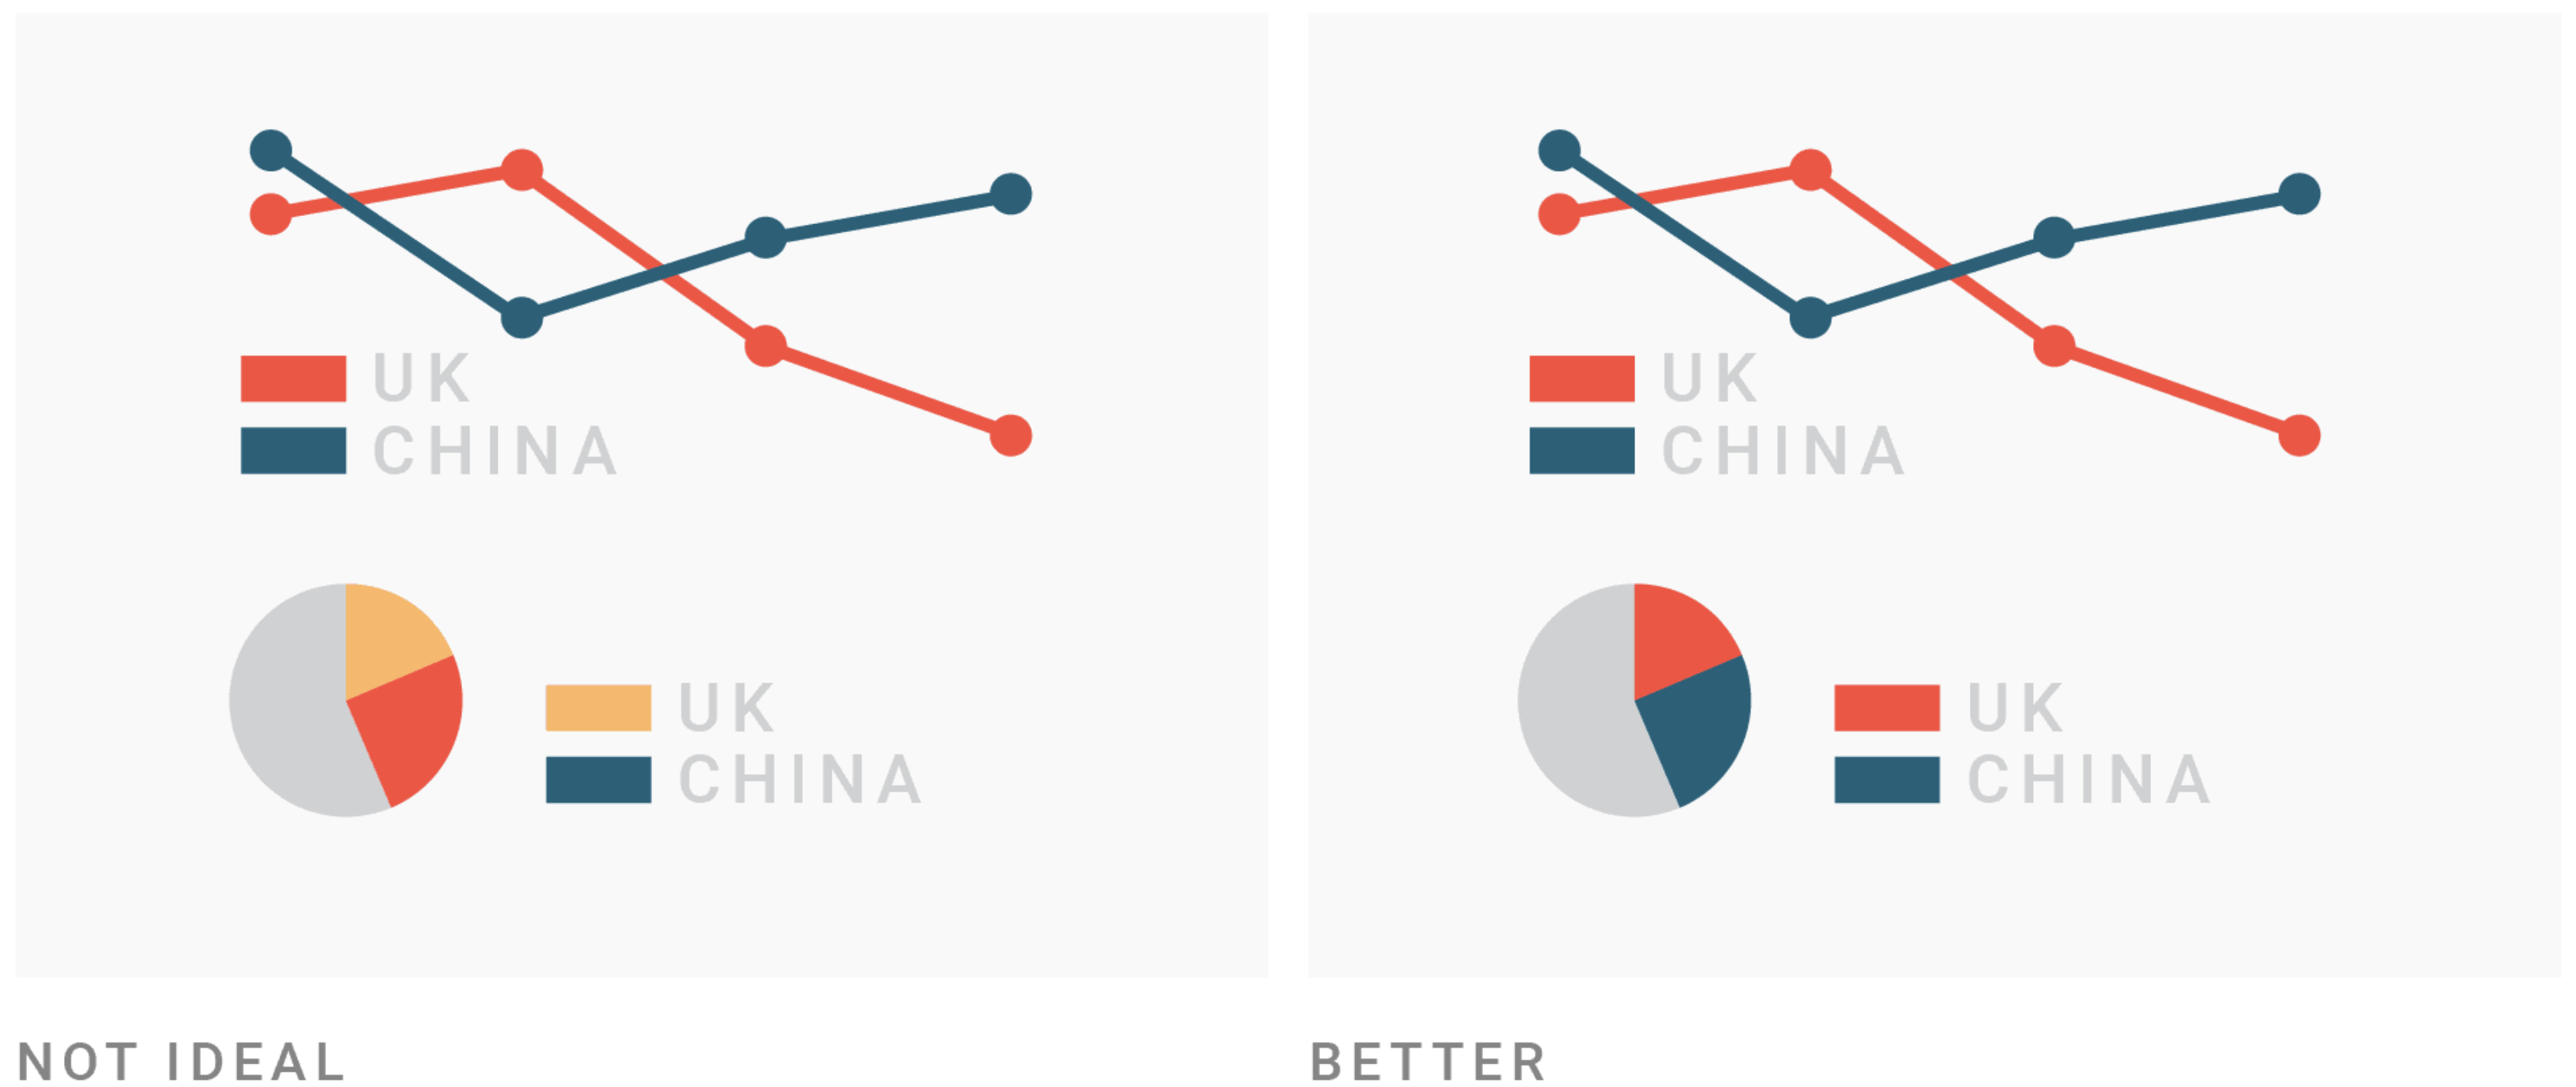
Color consistency
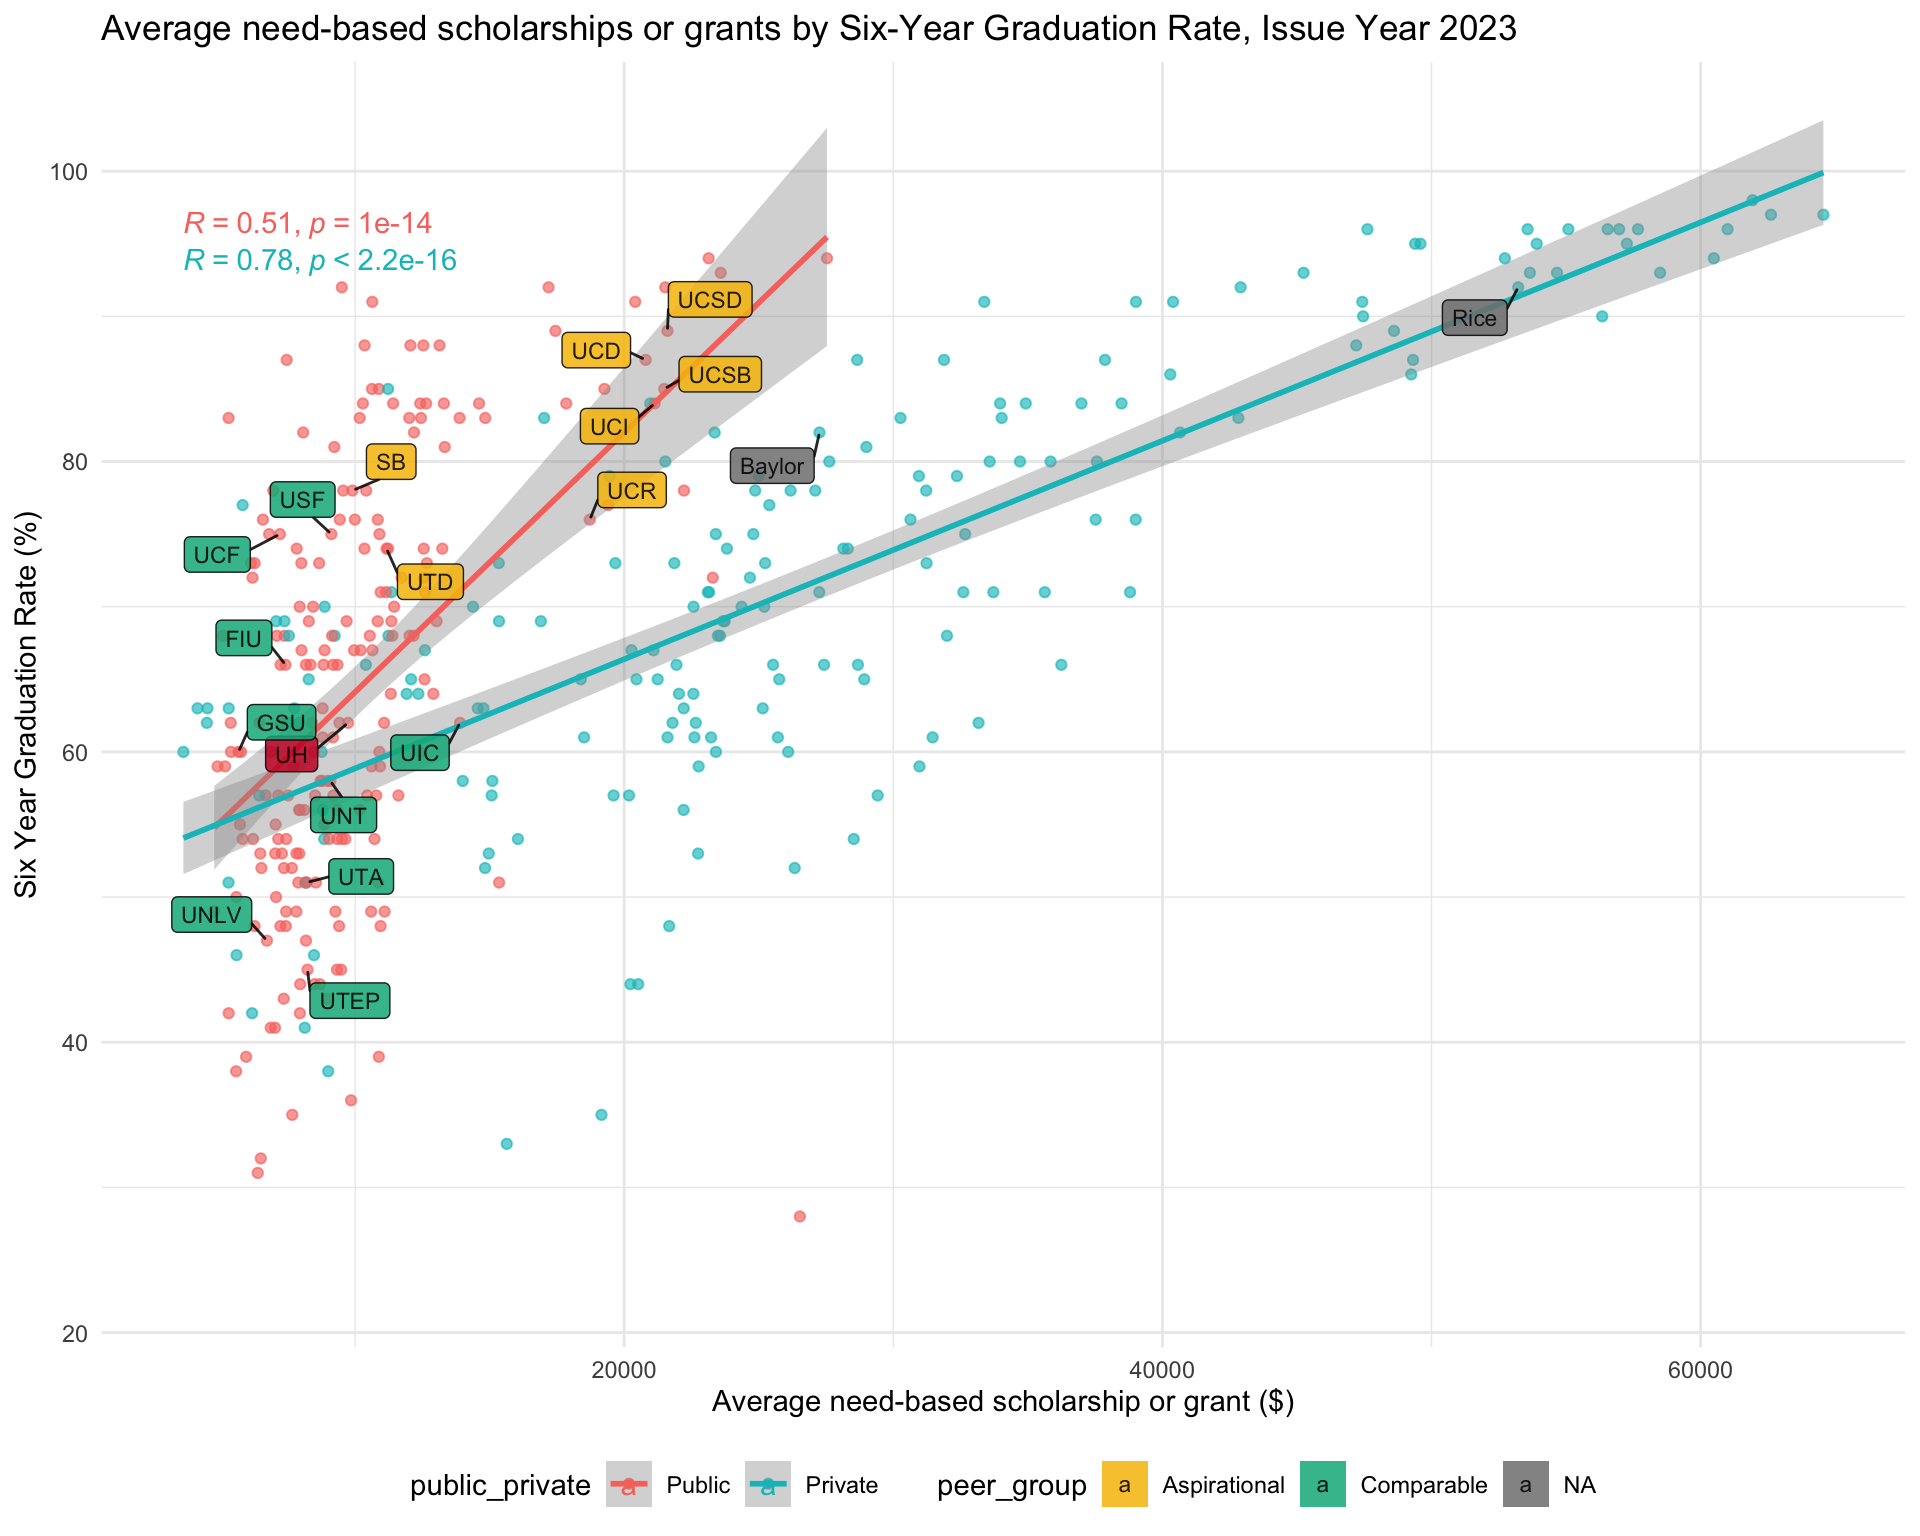
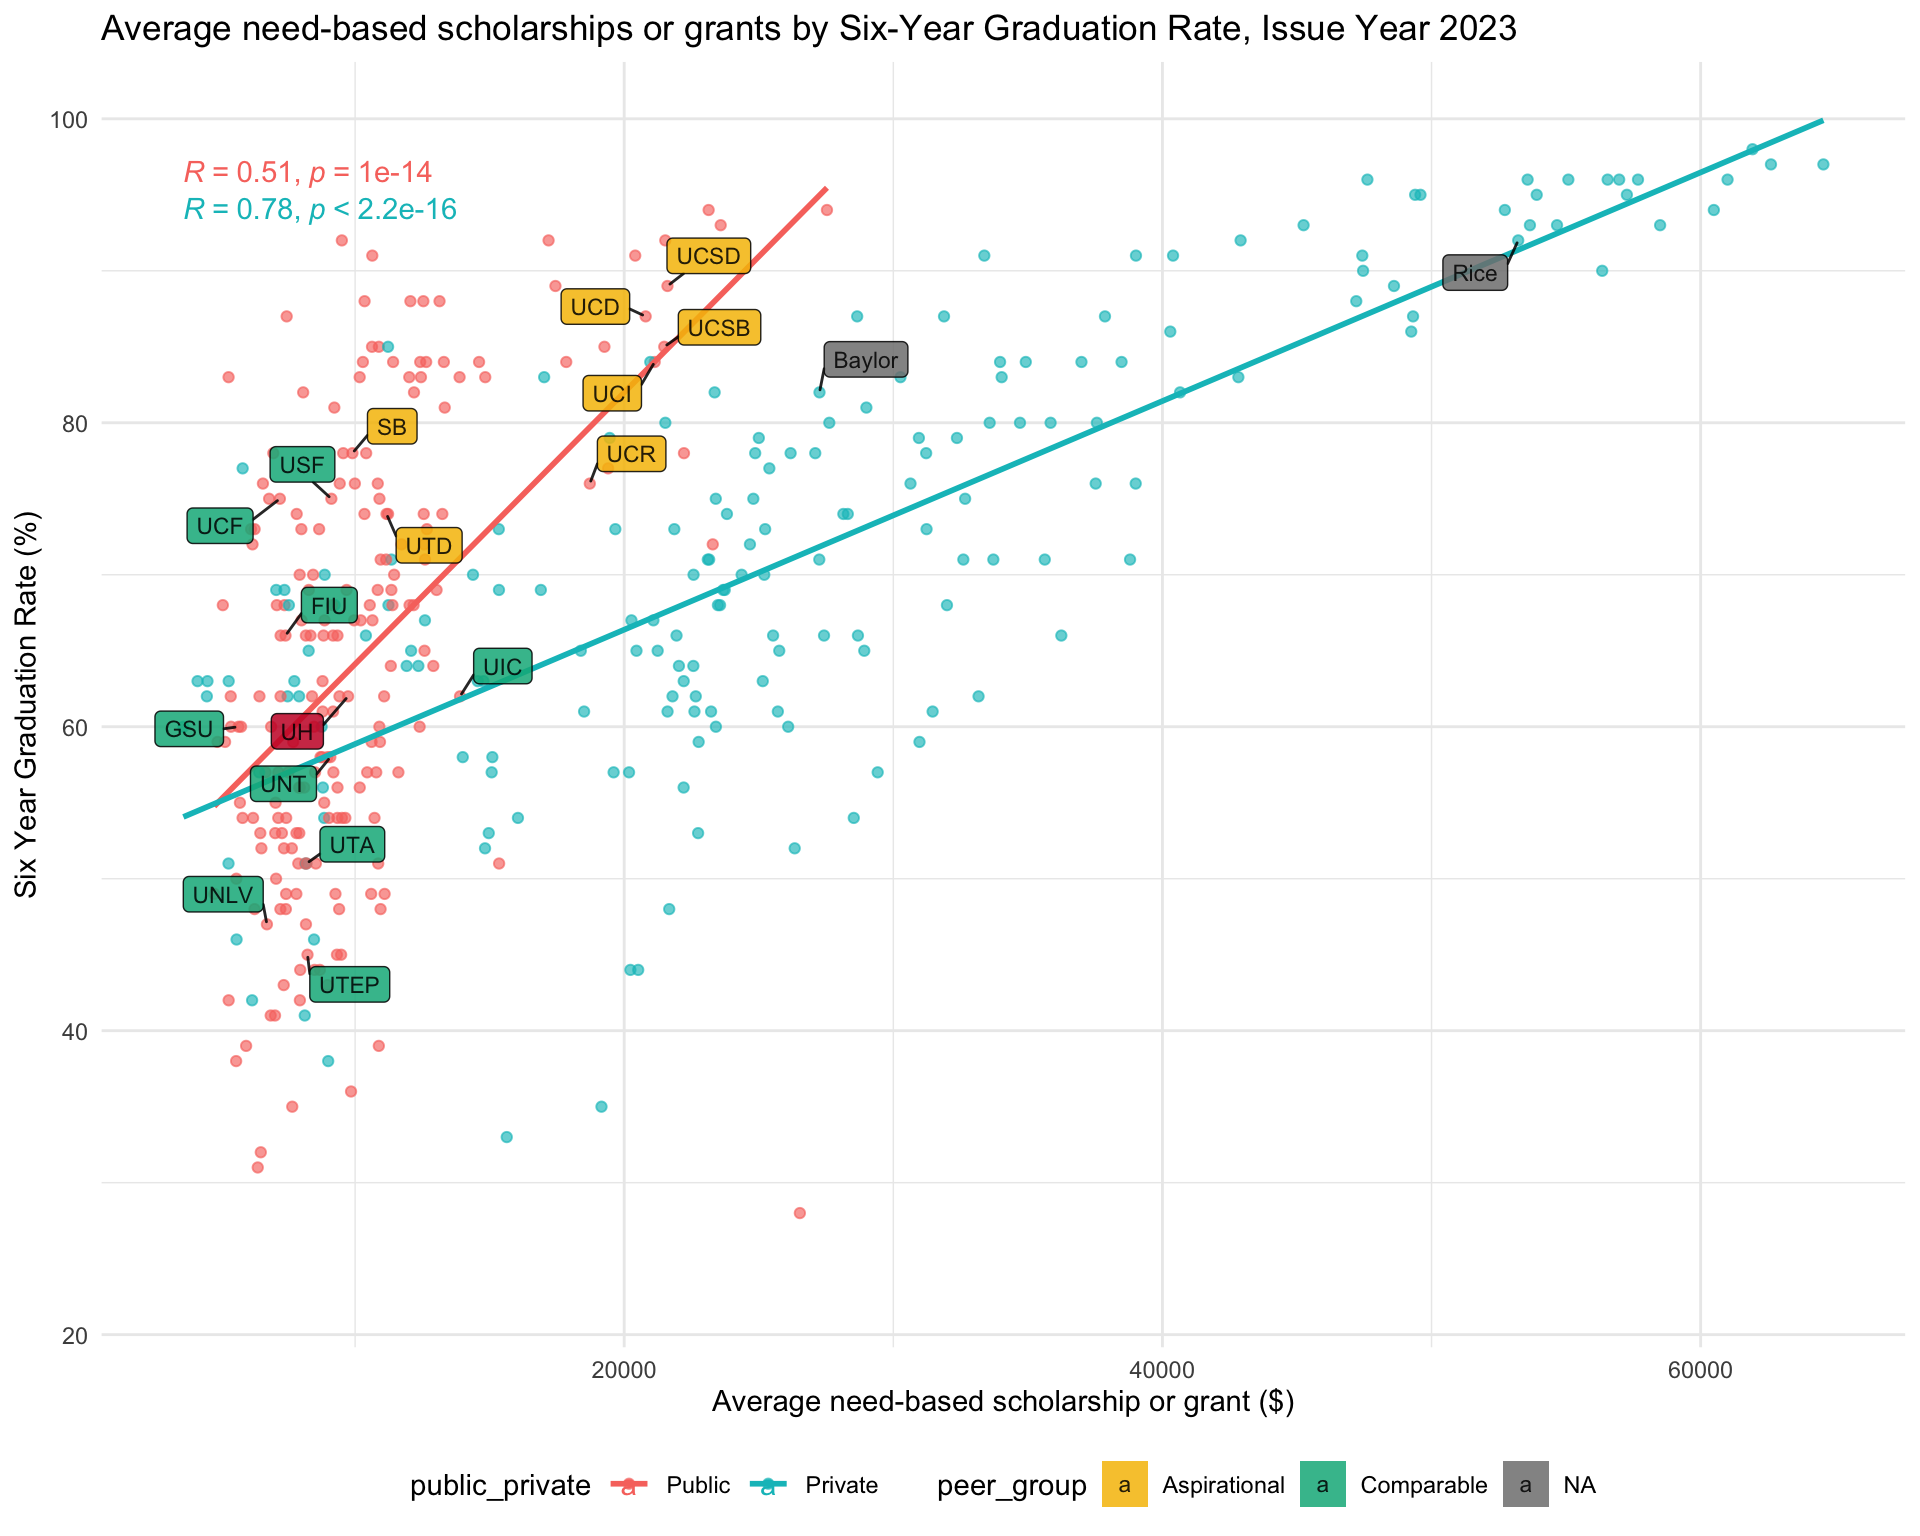
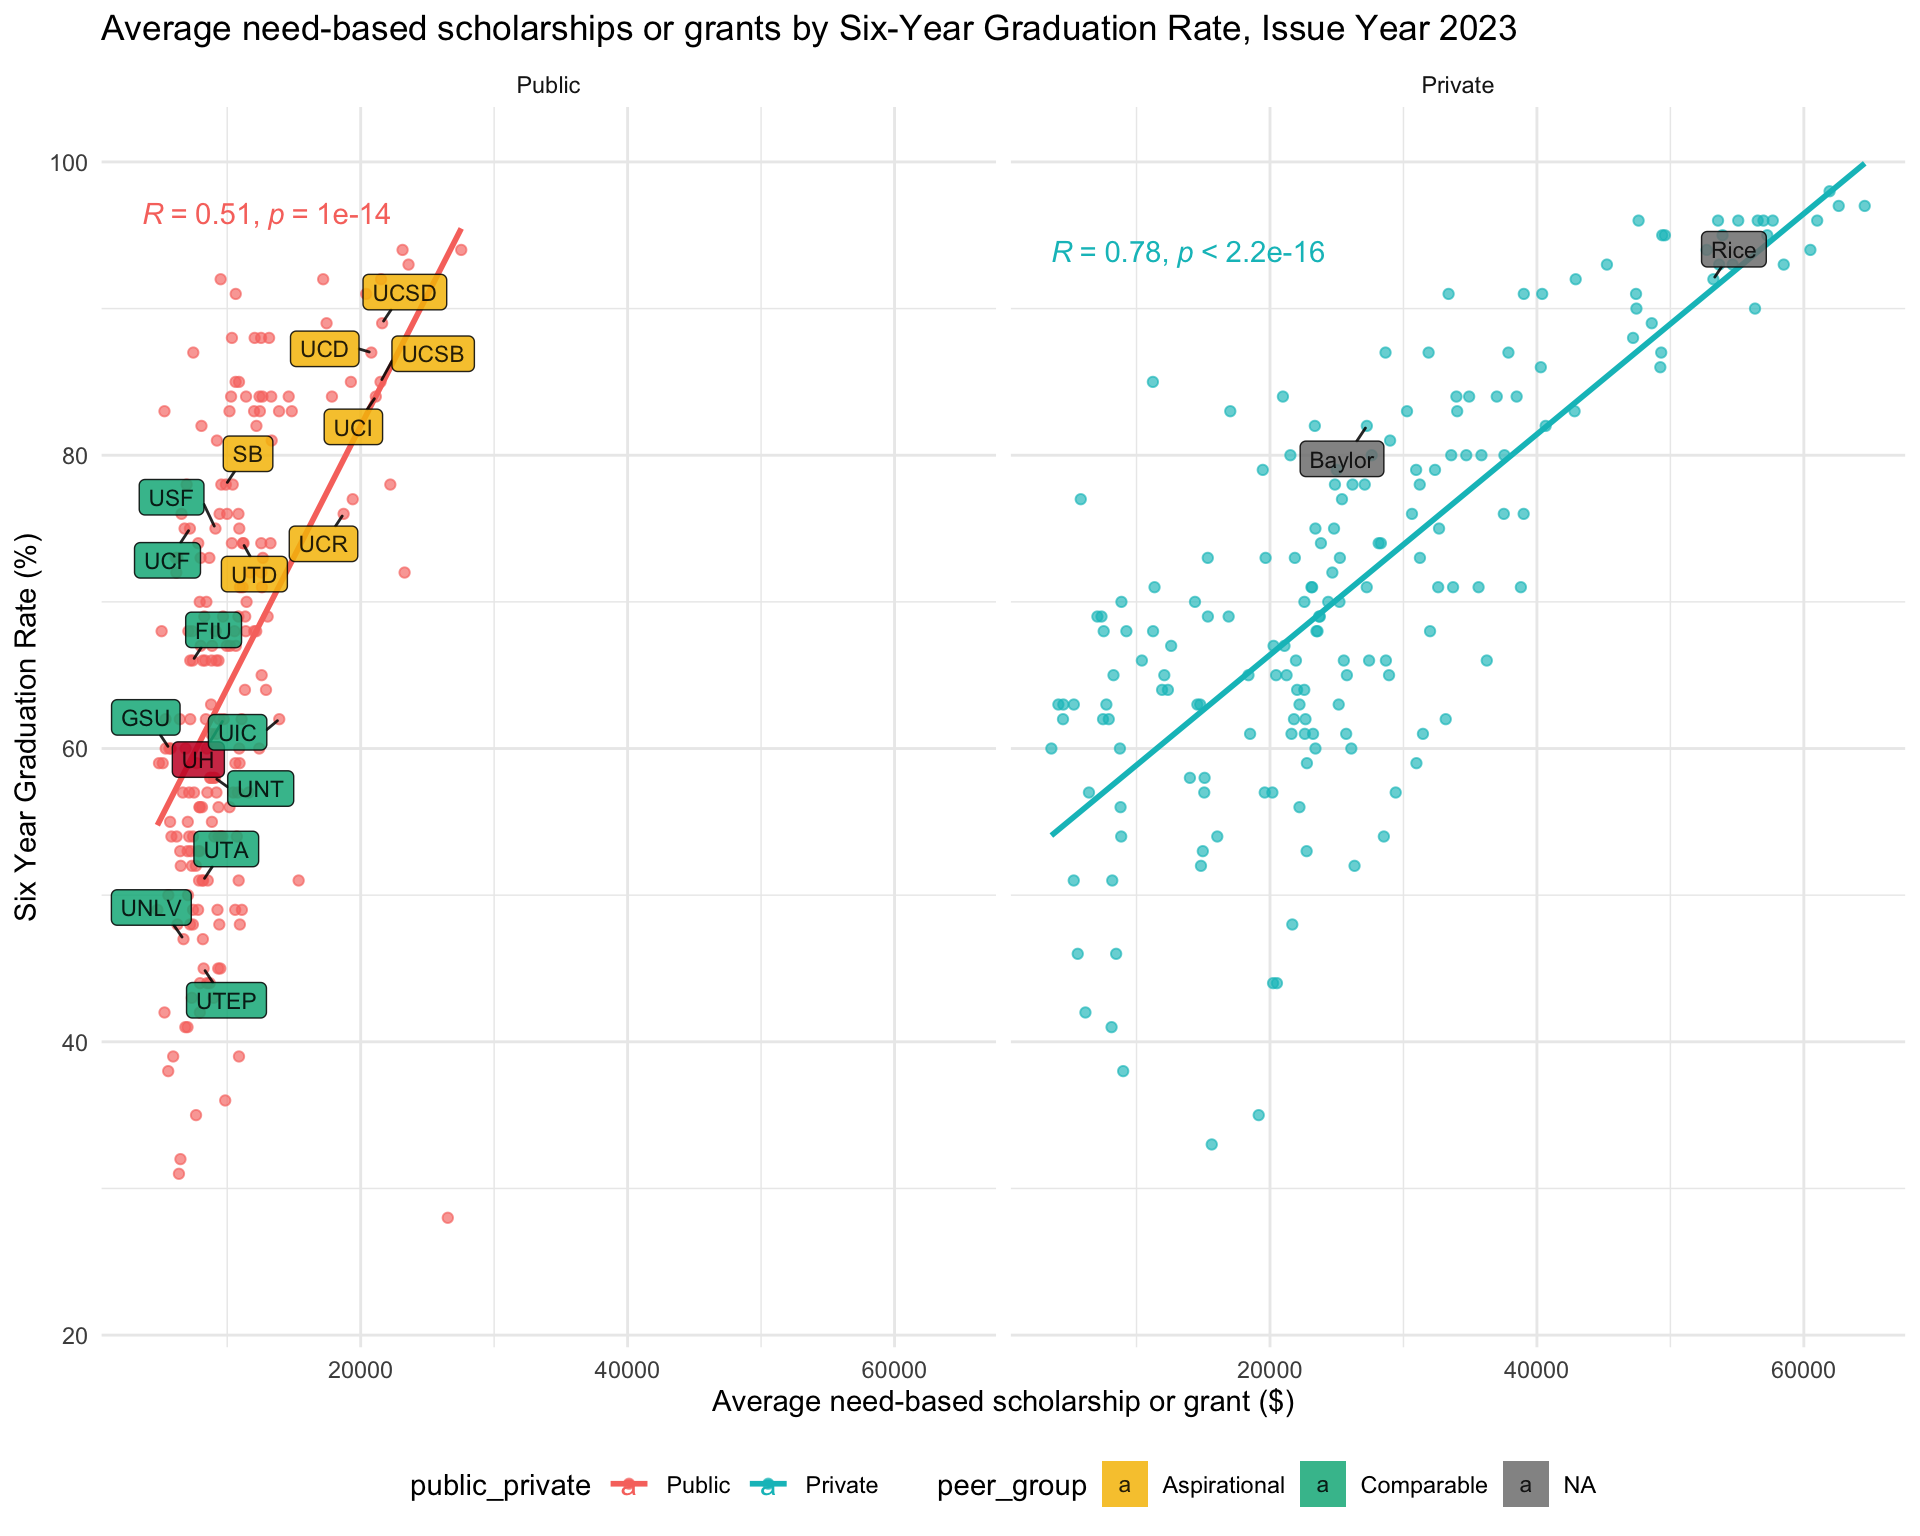
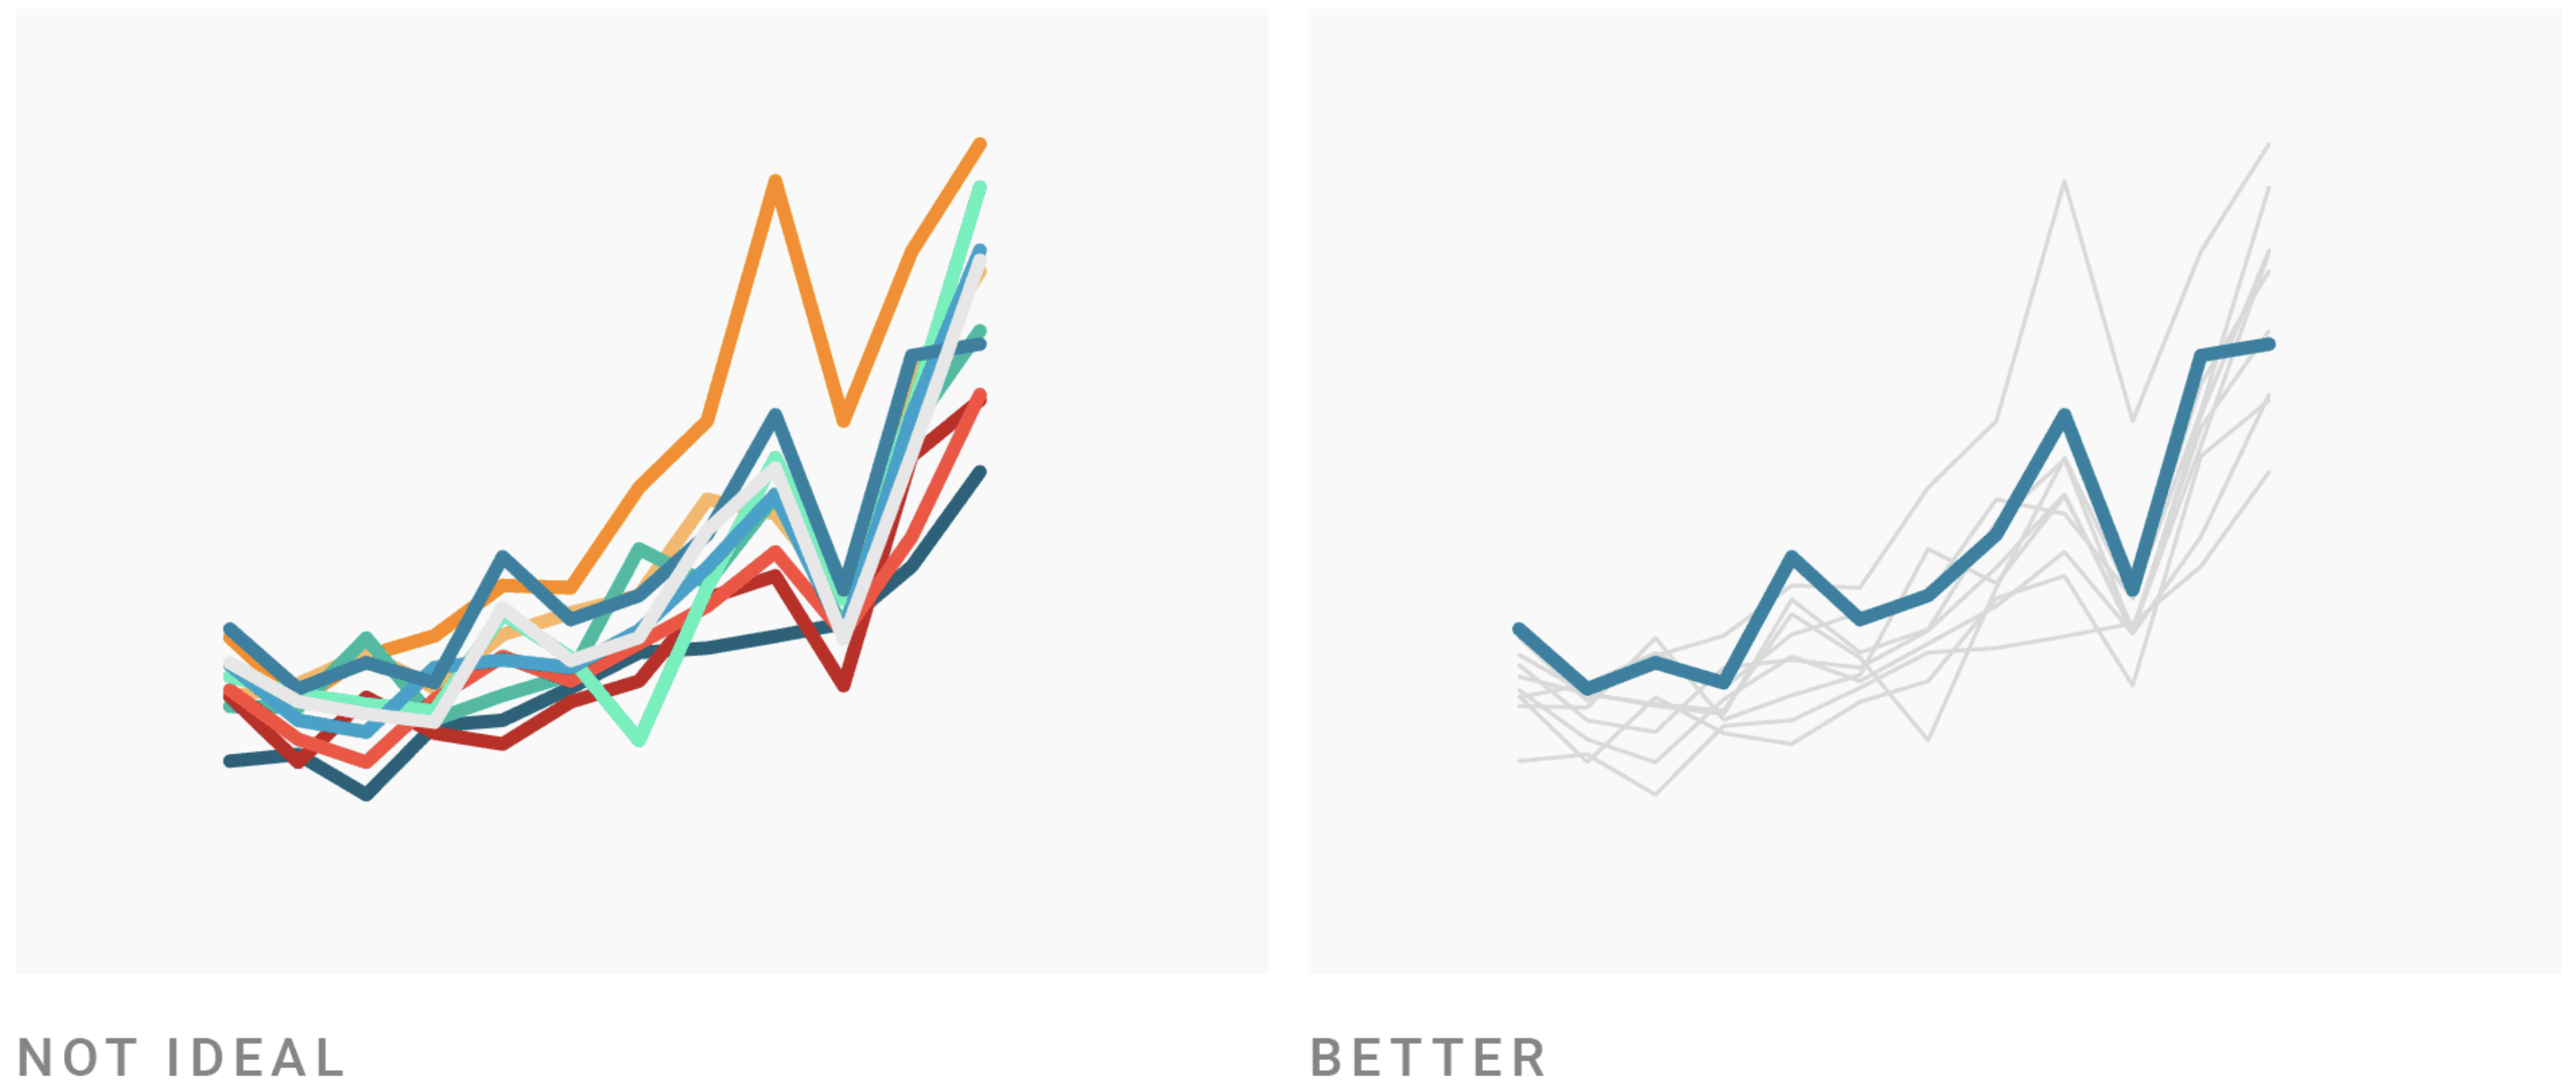
Color to highlight relationships in context
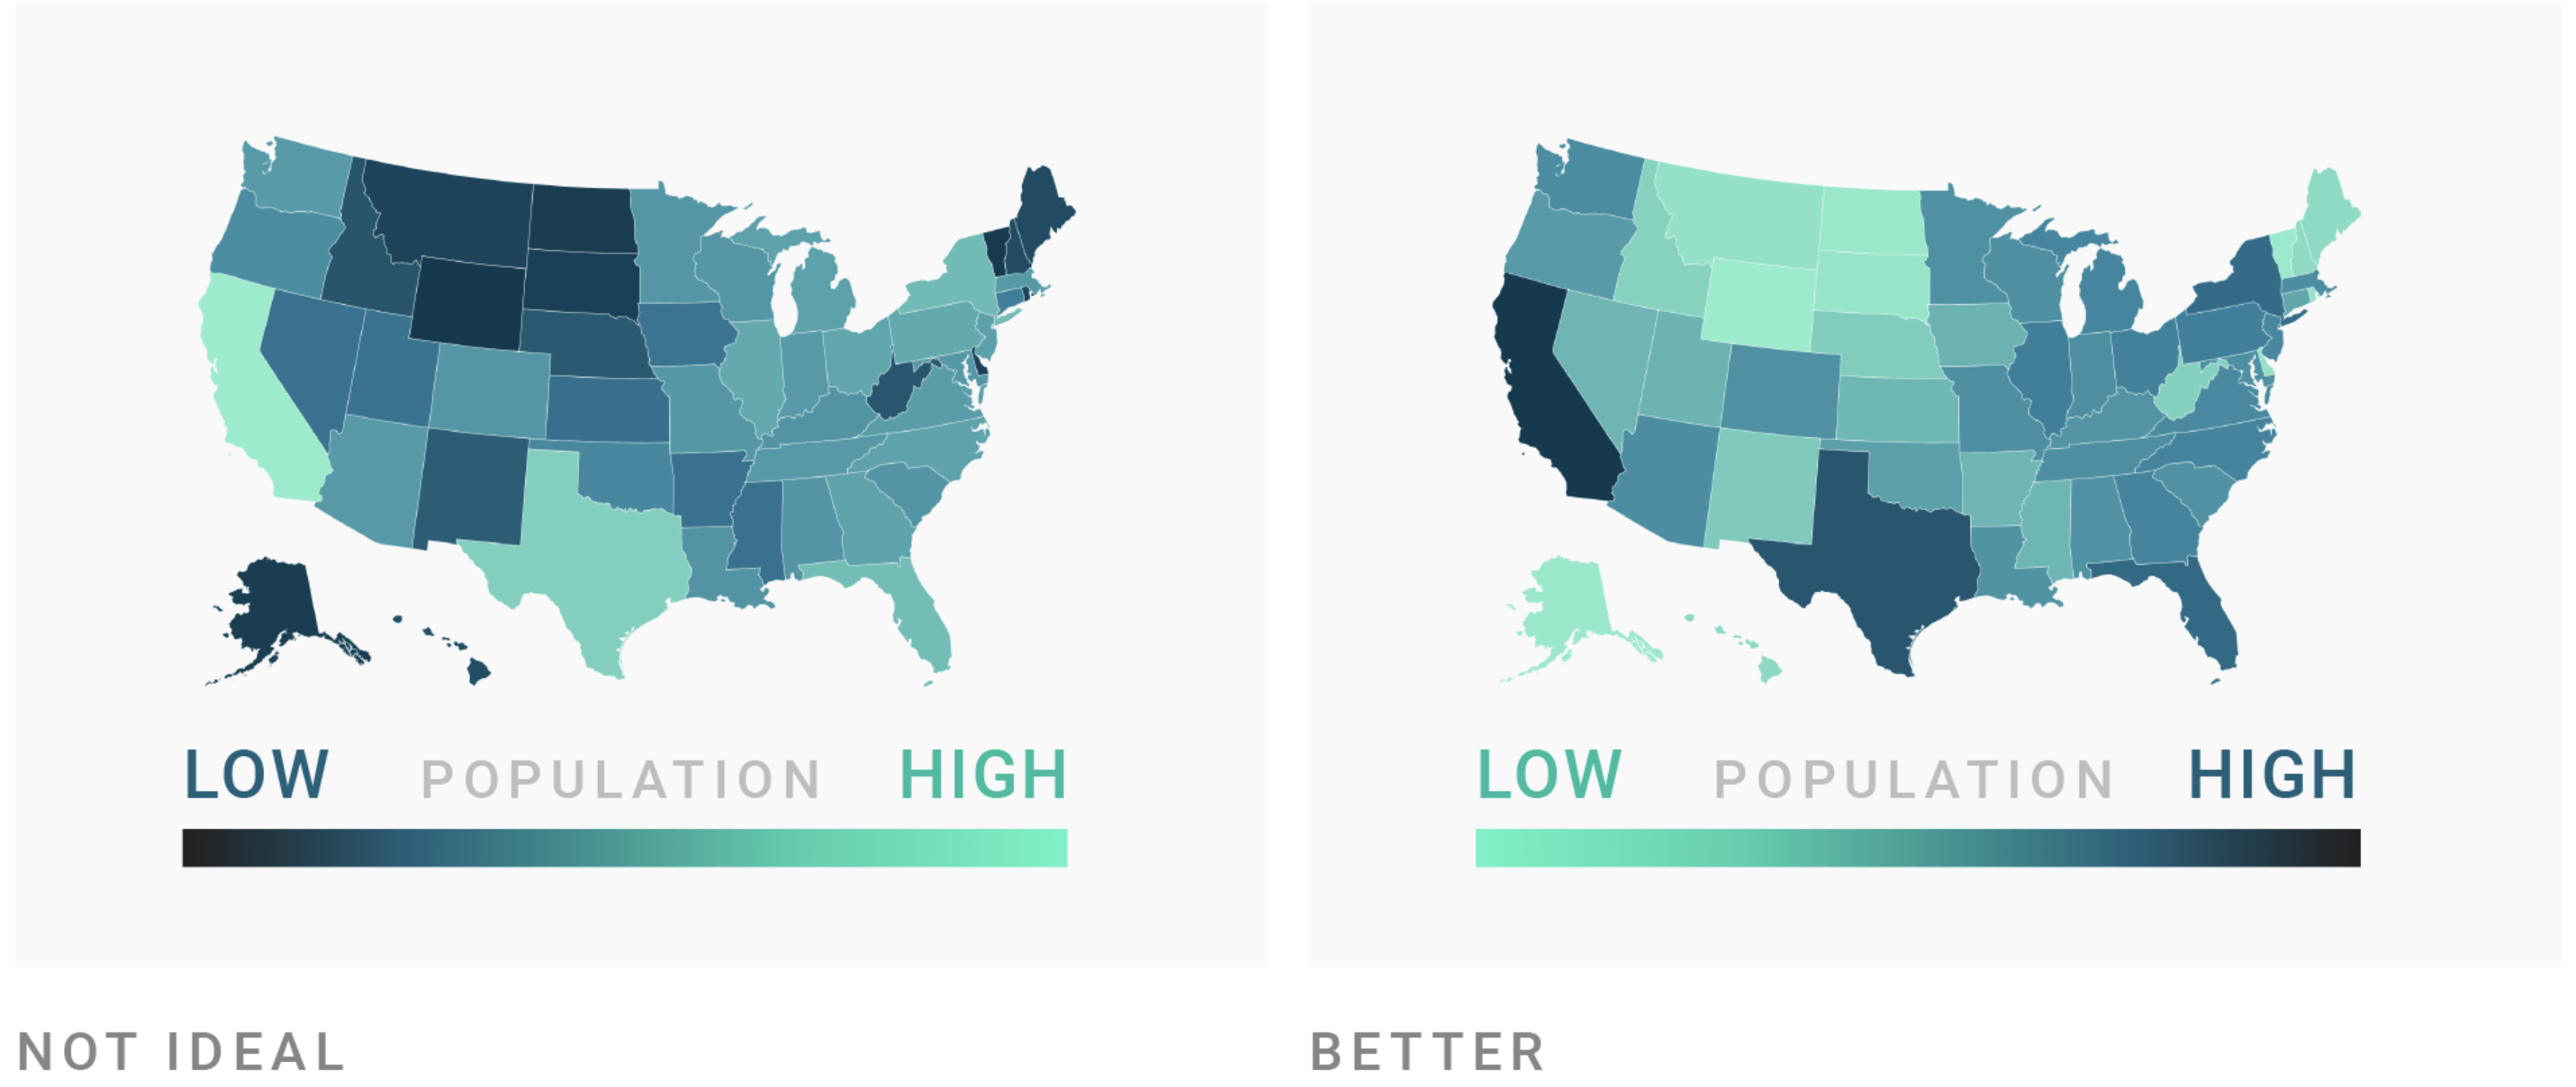
Color ramps must match psychology
Accessible colors
Equity Awareness
Equity awareness in data visualization1
Data analysts should think intentionally about how we can learn from and speak to audiences that reflect the diversity of the people and communities we focus
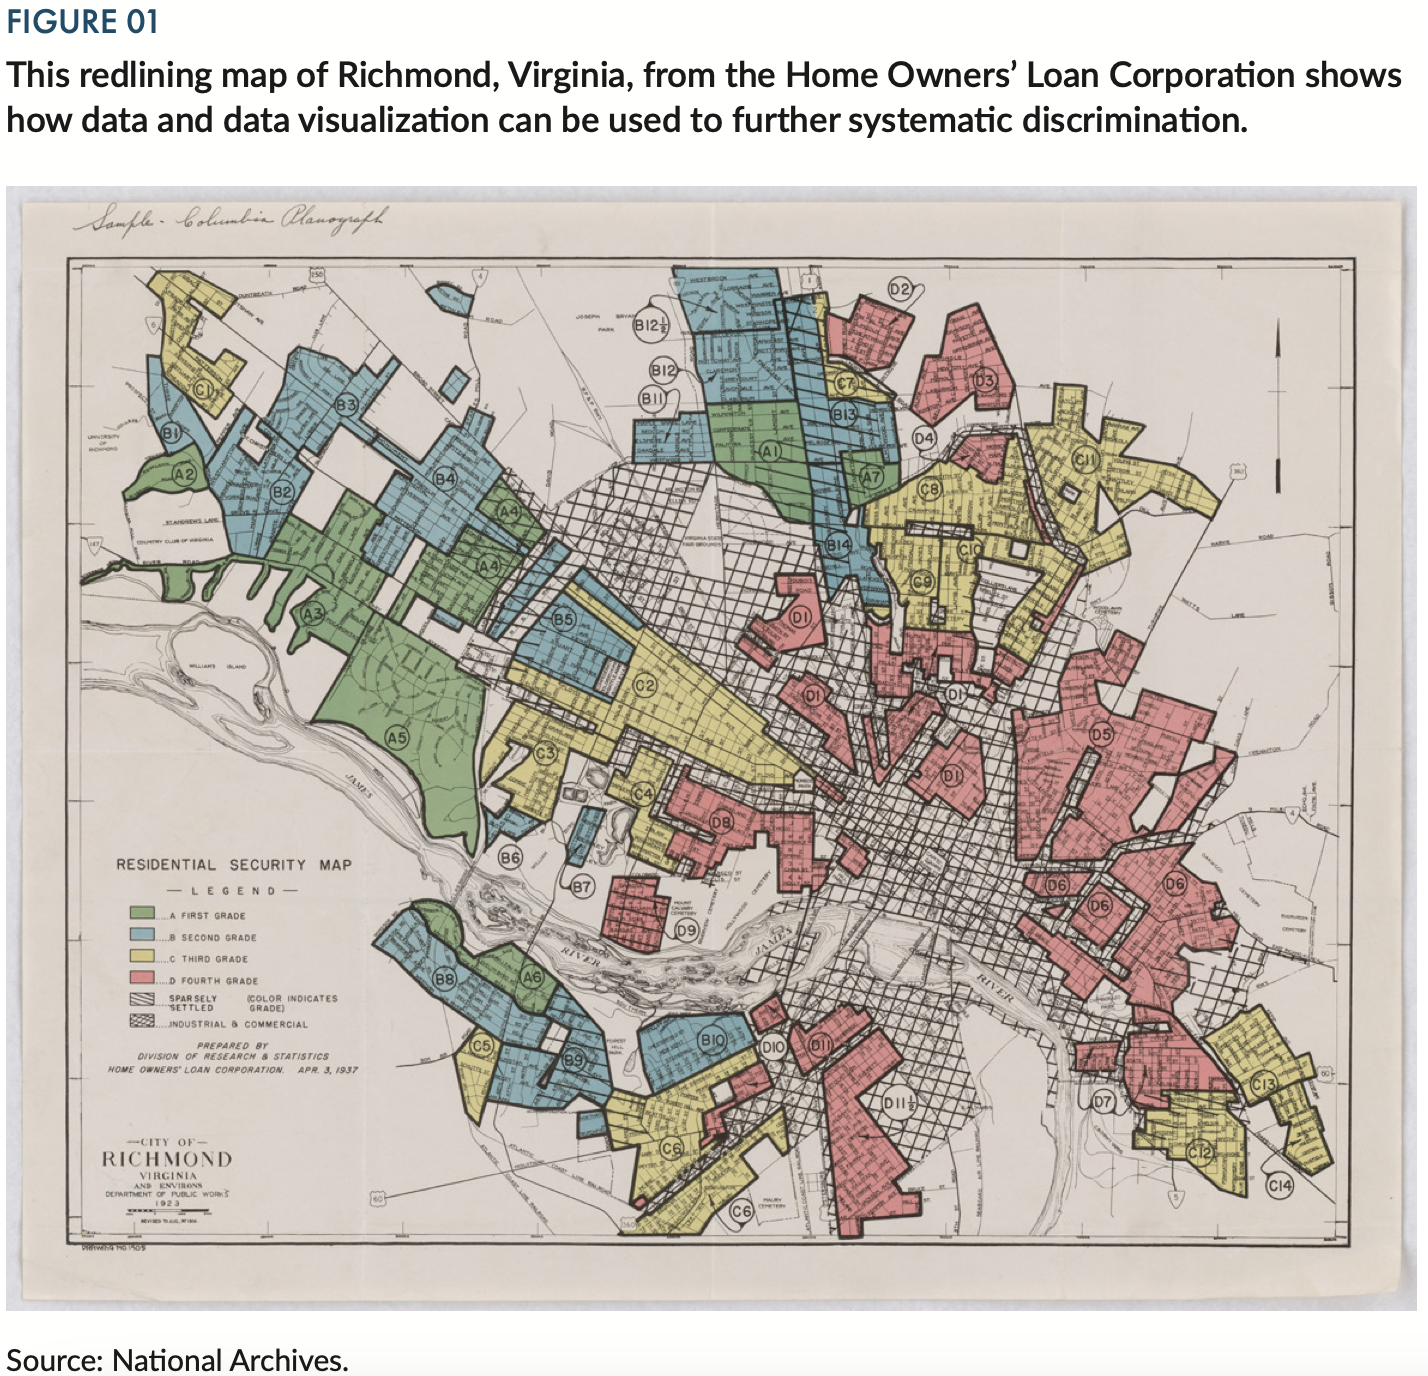
Systemic discrimination is and can be generated by how we use and misuse data
If I were one of the data points on this visualization, would I feel offended? - Kim Bui
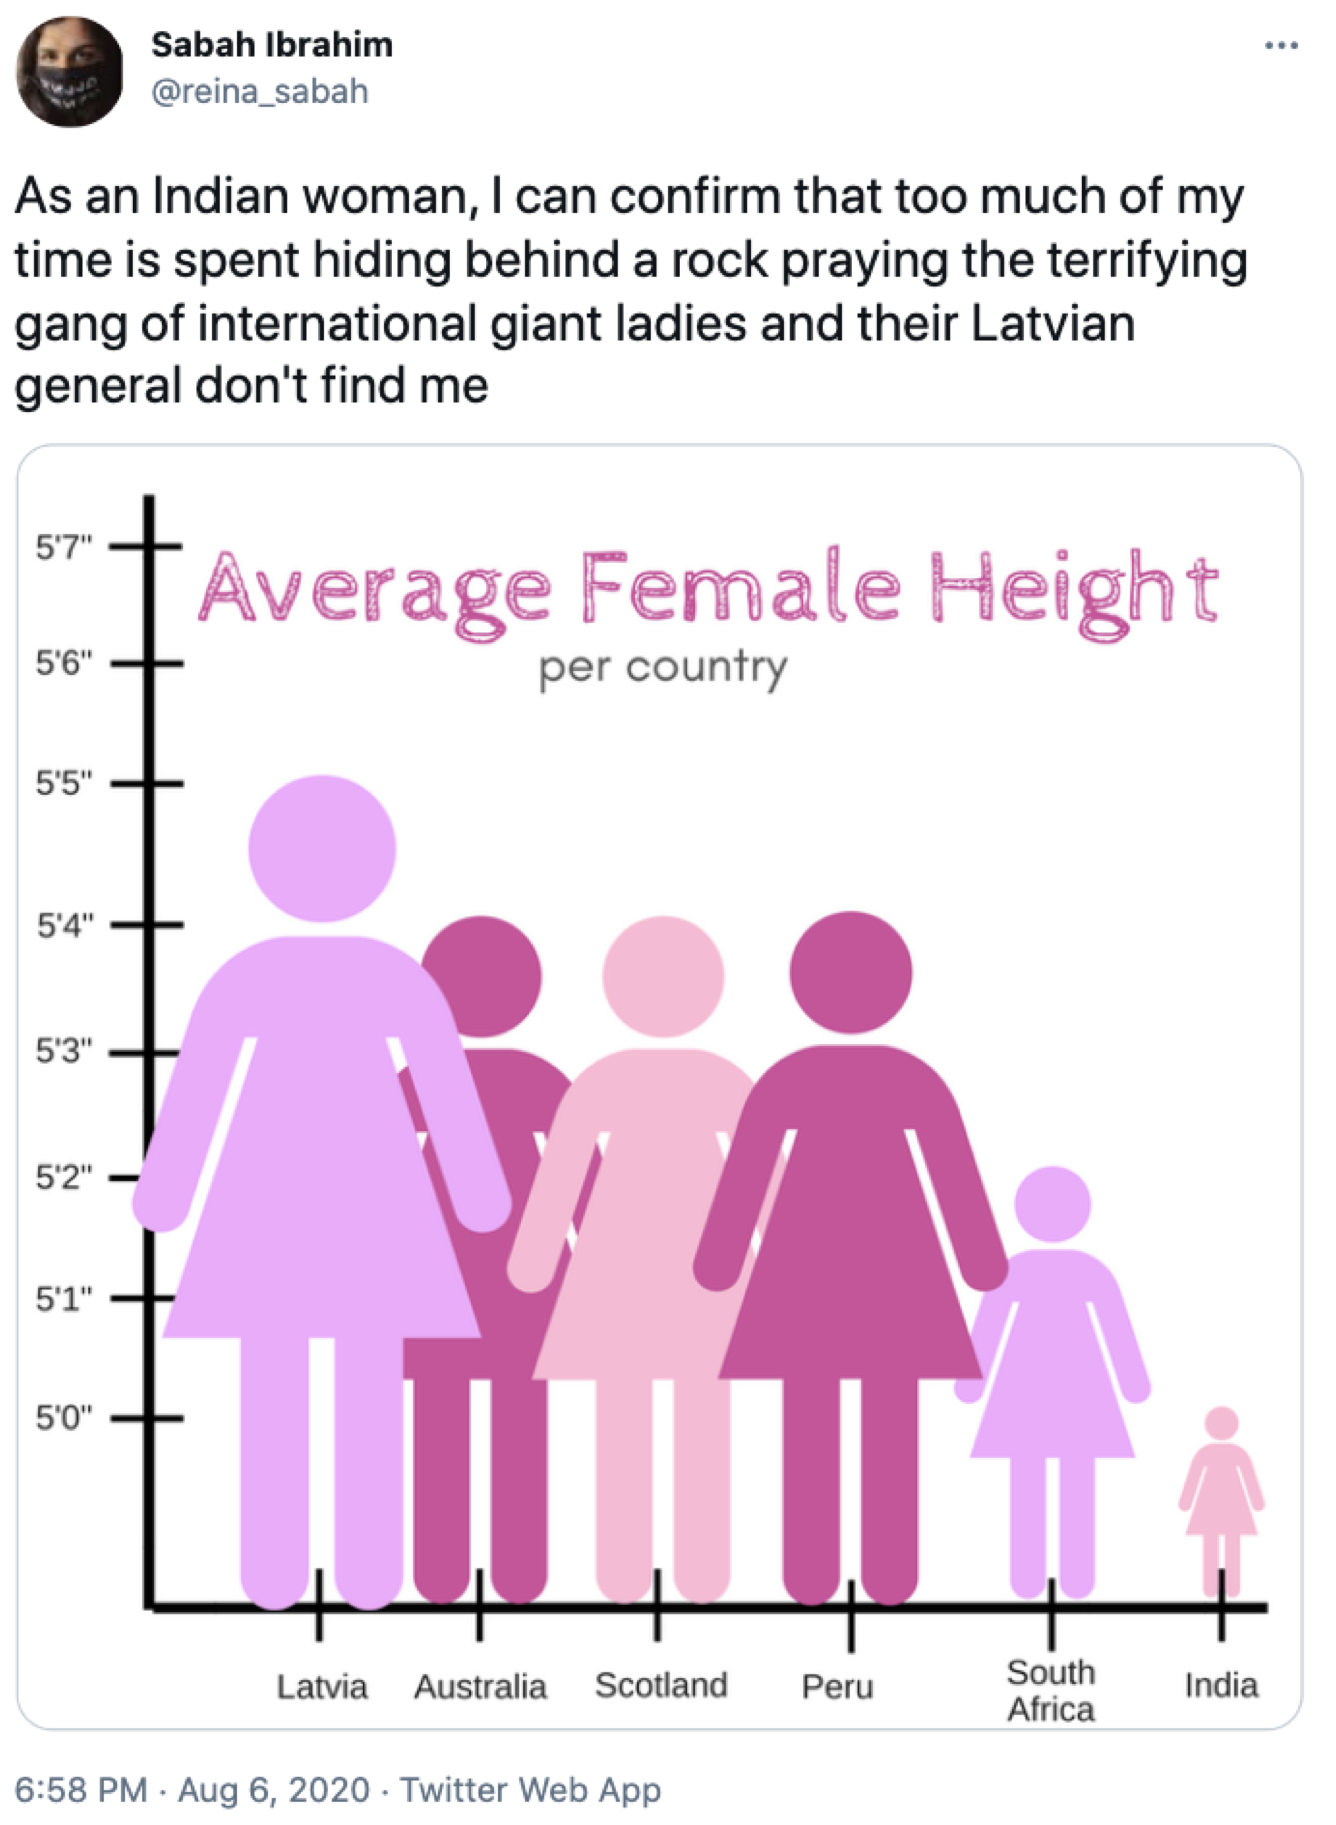
Put people first
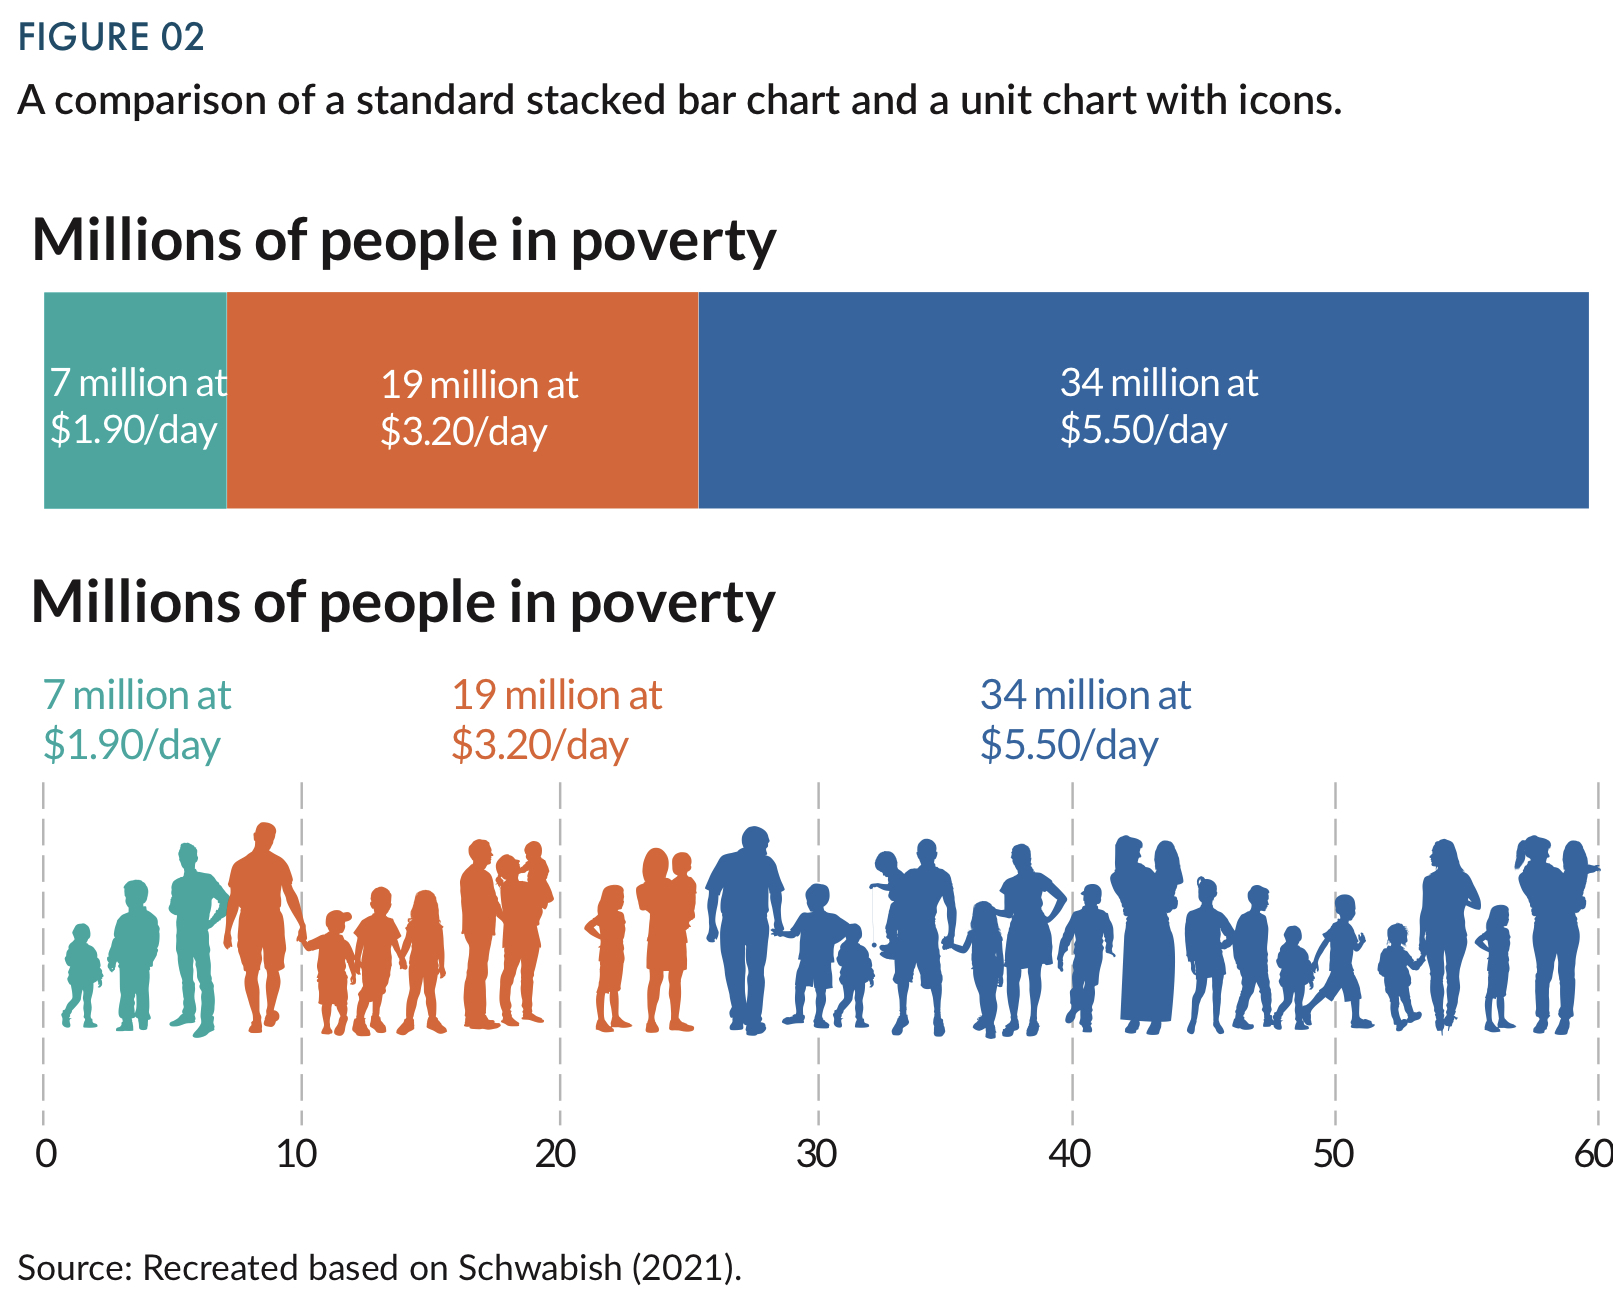
Put people first
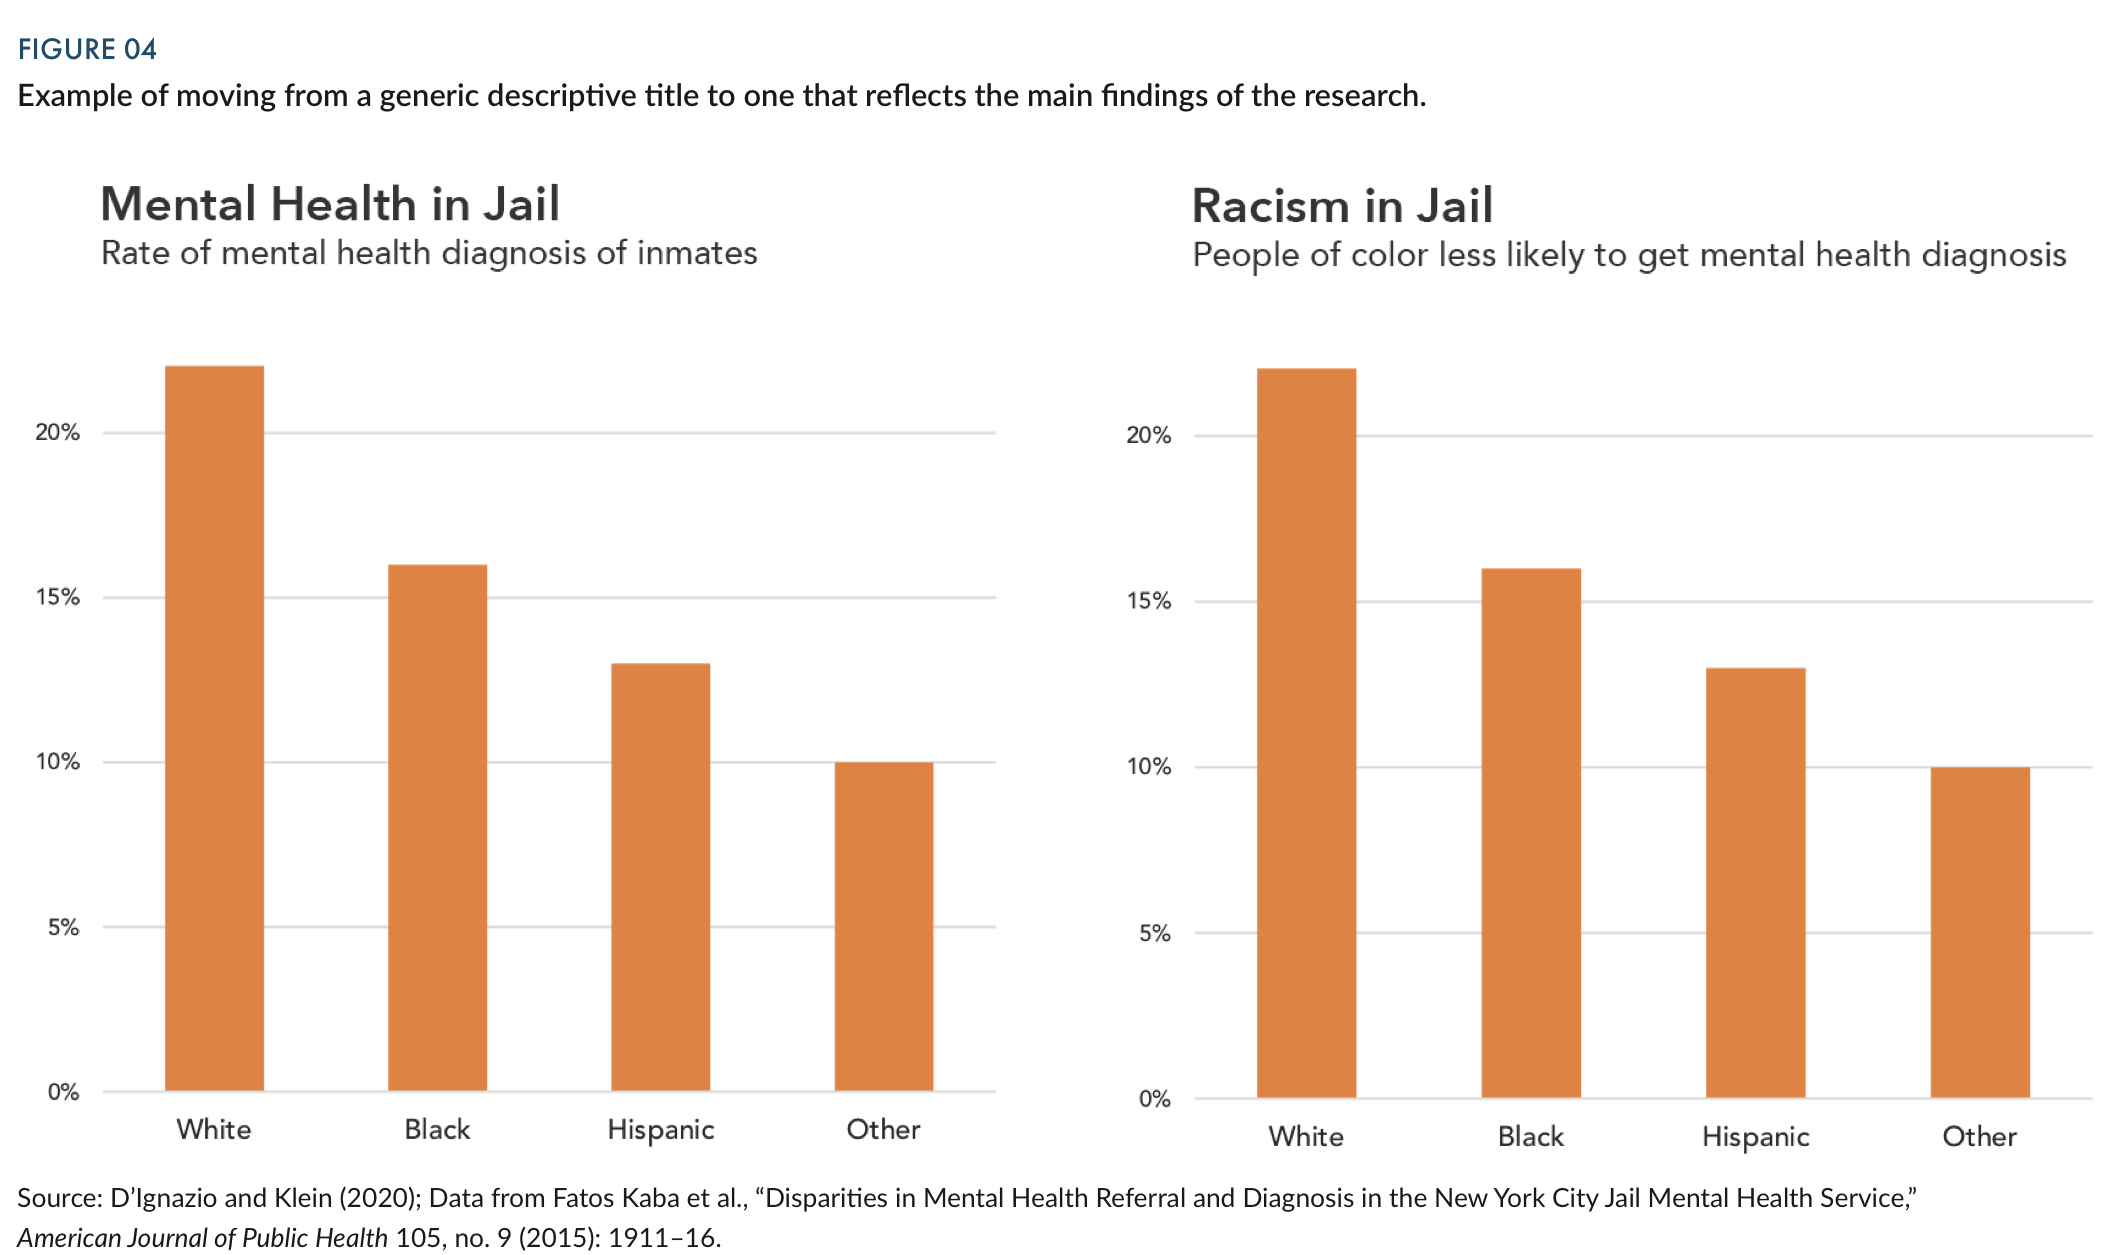
Language and racial equity awareness
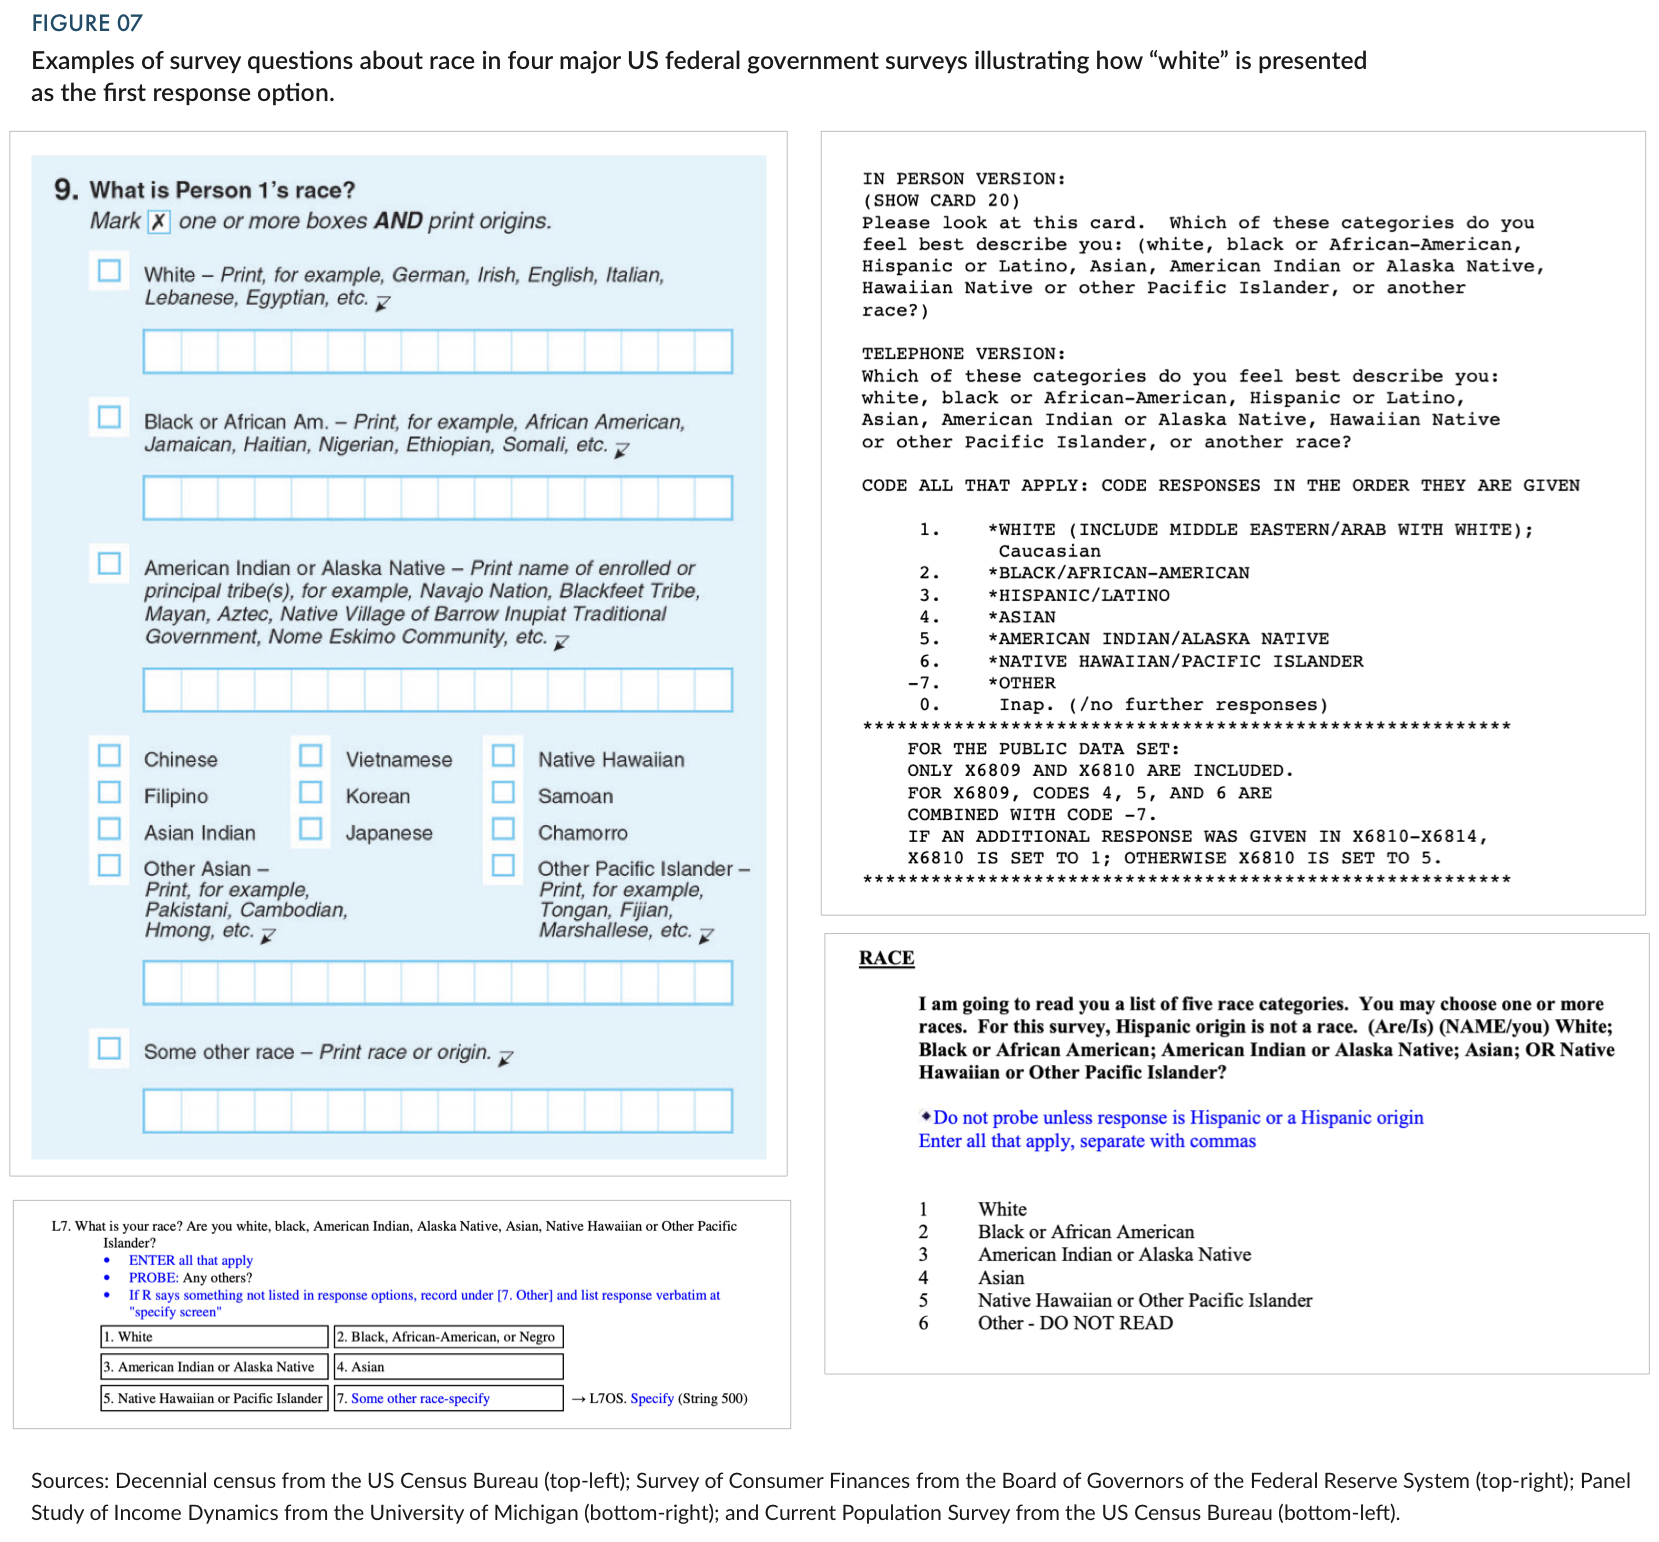
Ordering data purposefully
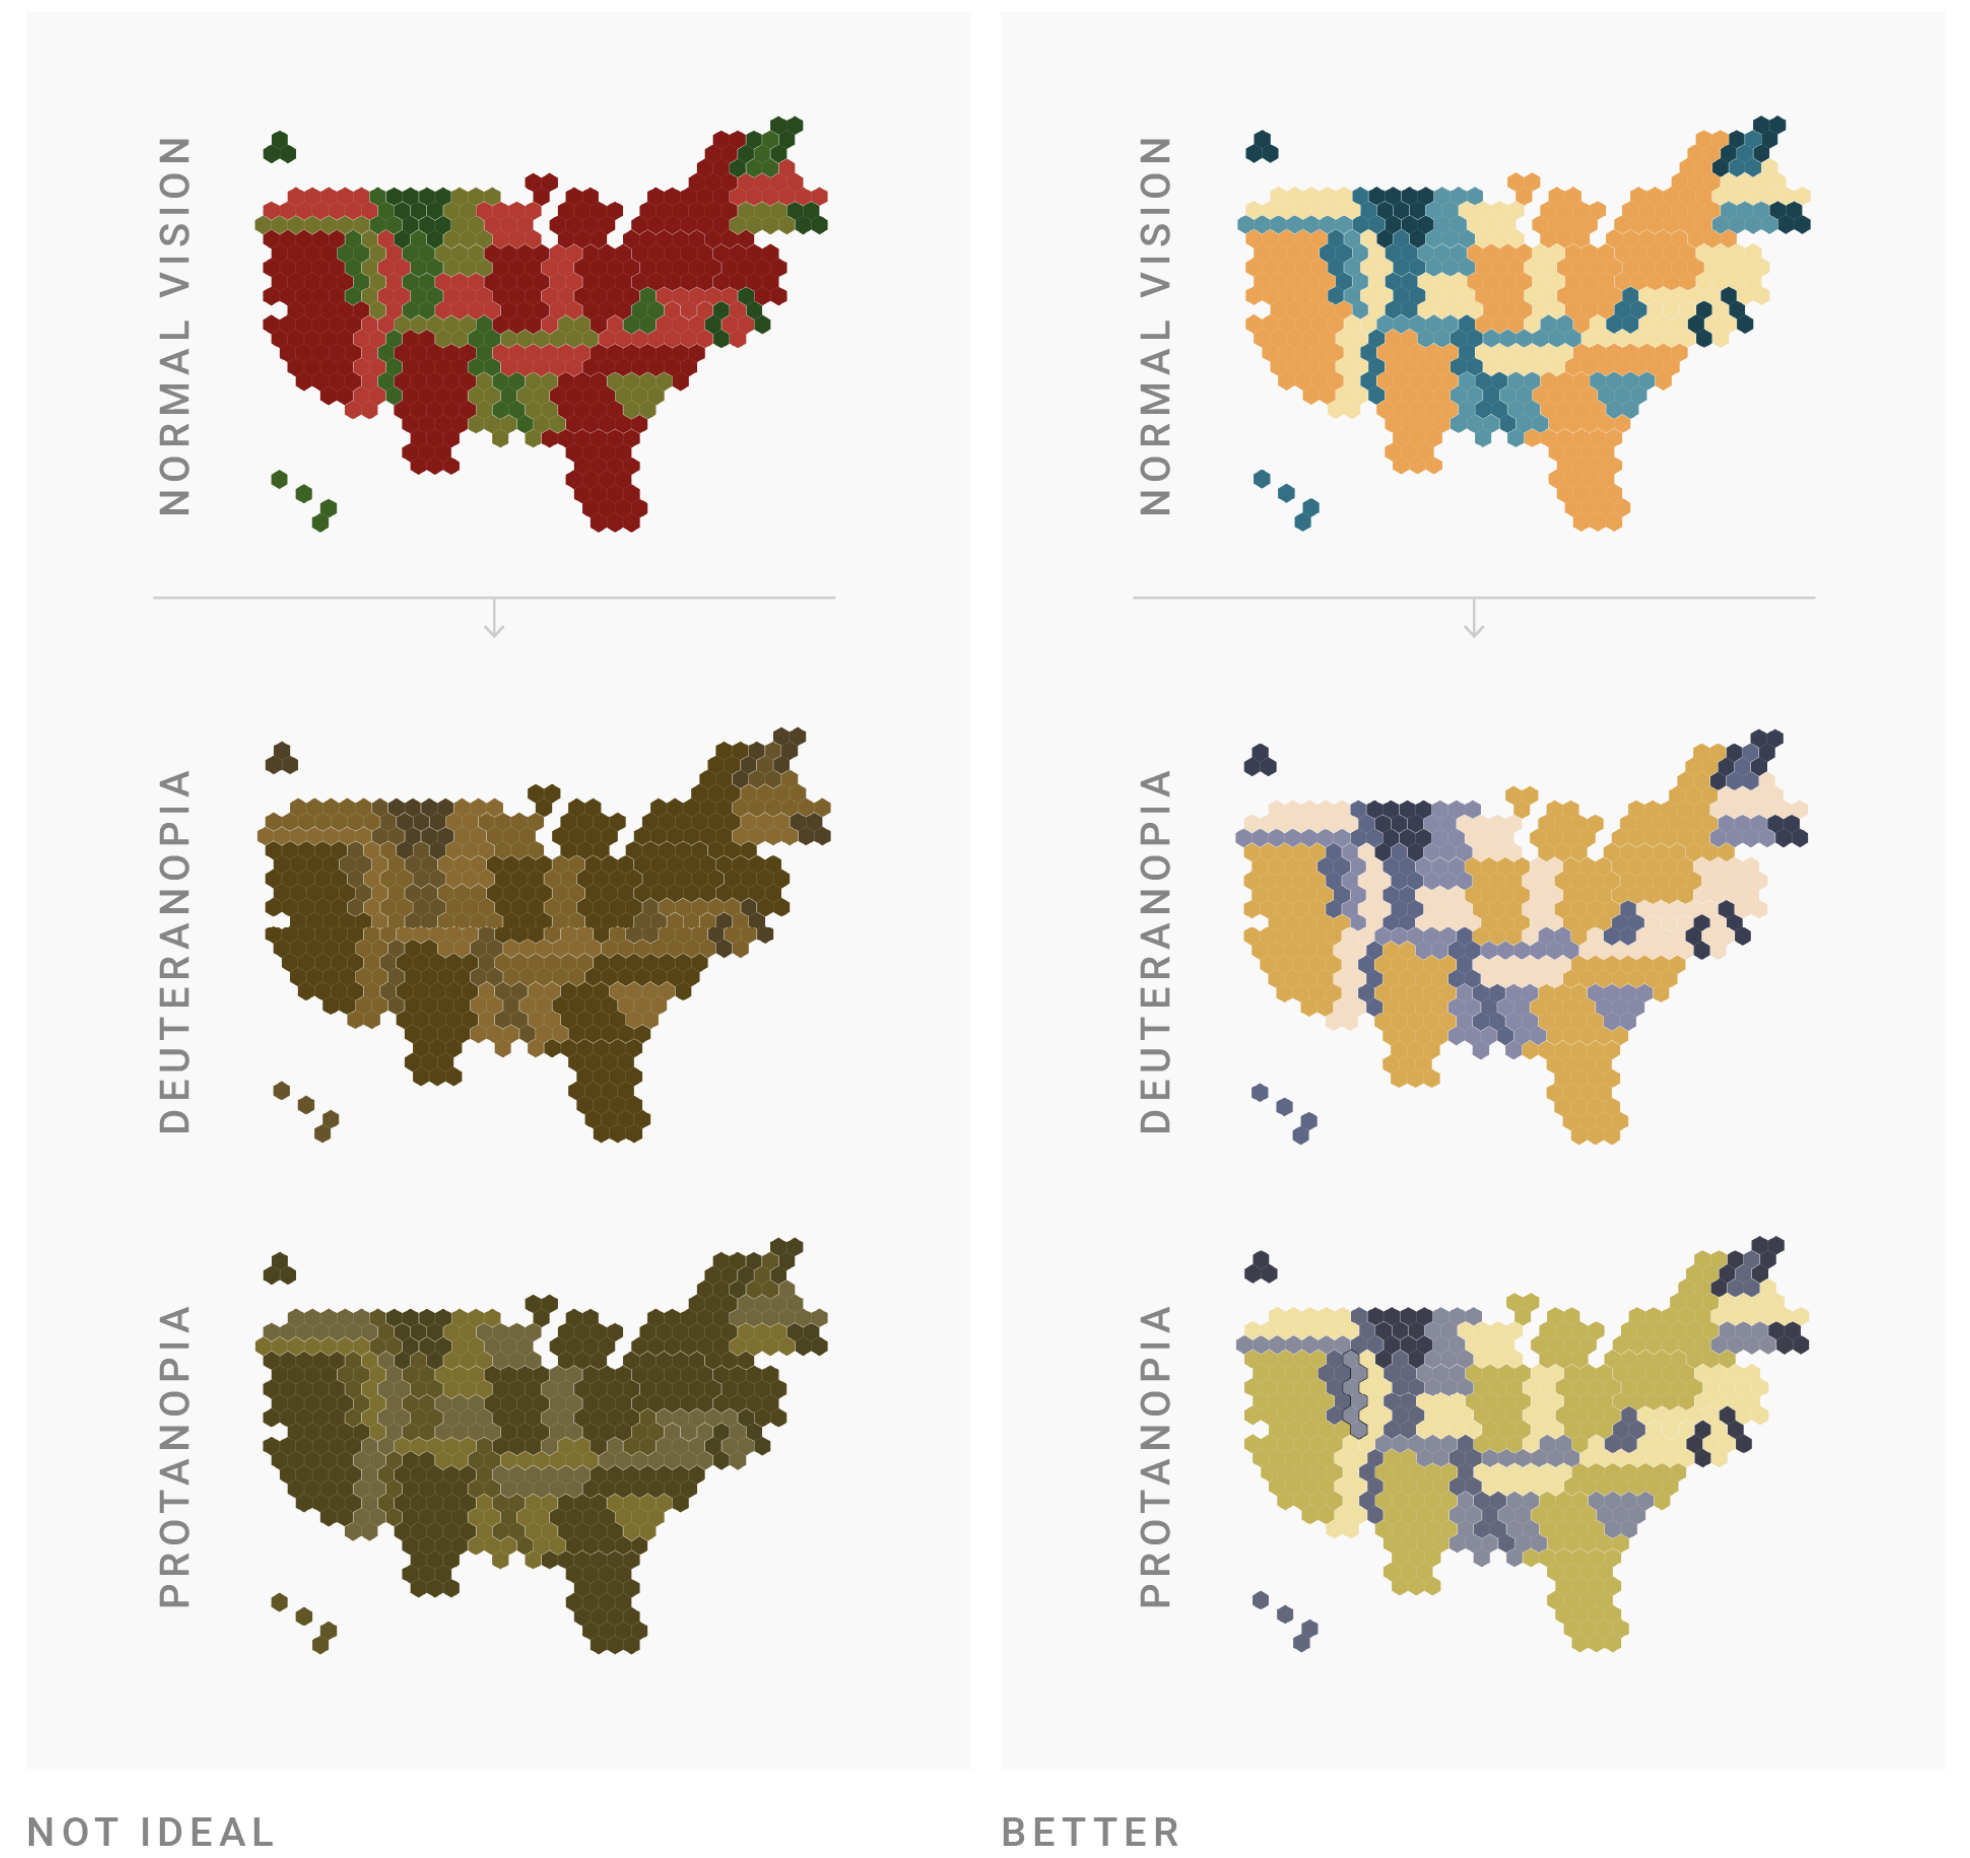
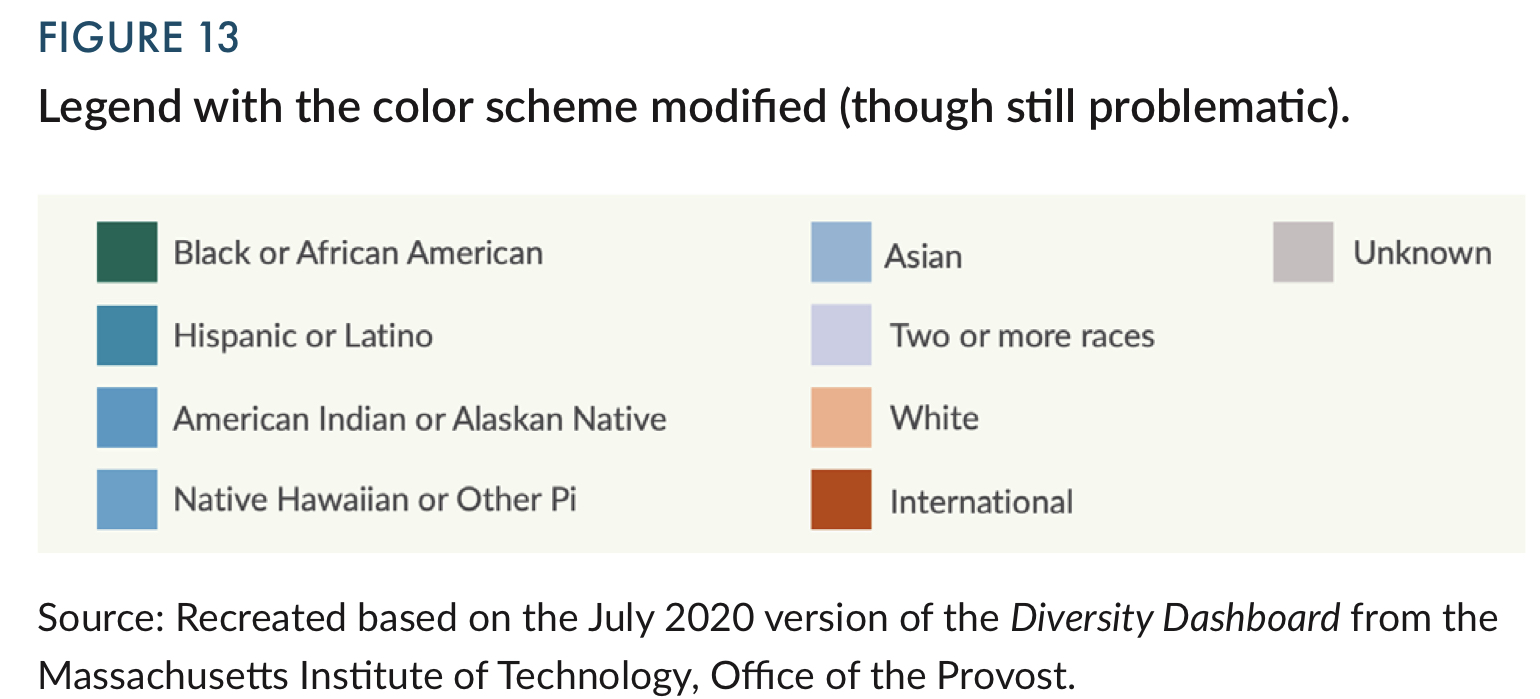
Colors and equity awareness
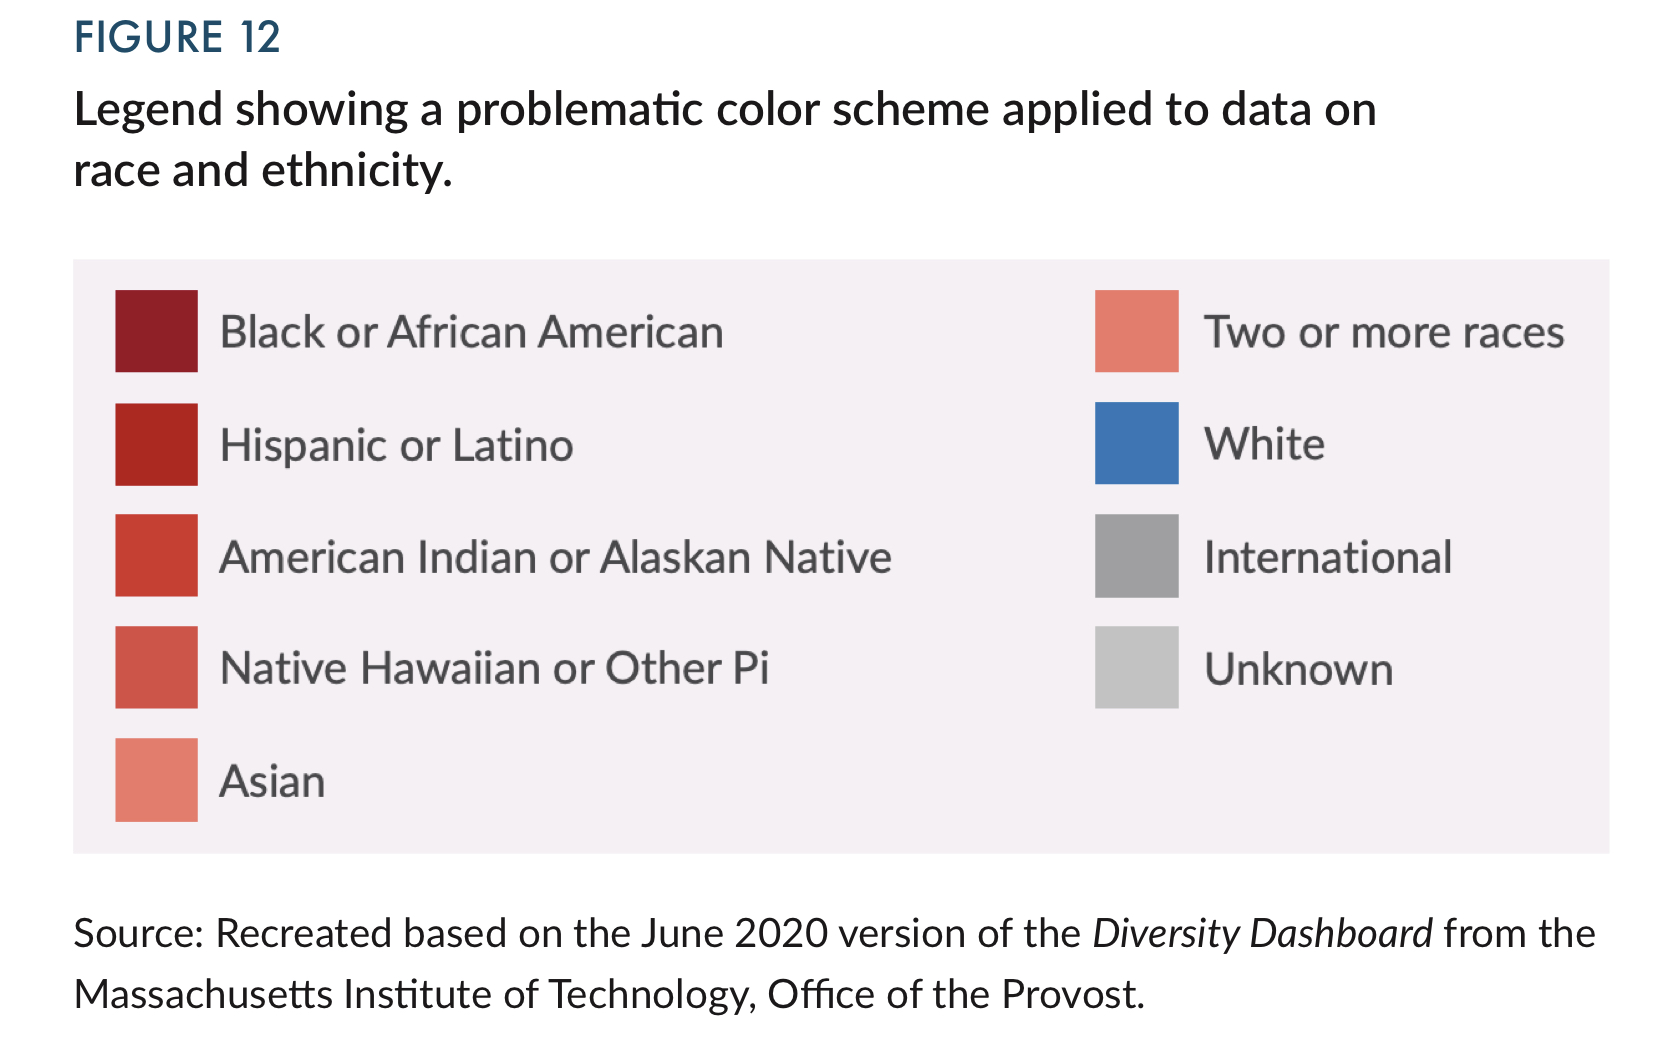
Colors and equity awareness
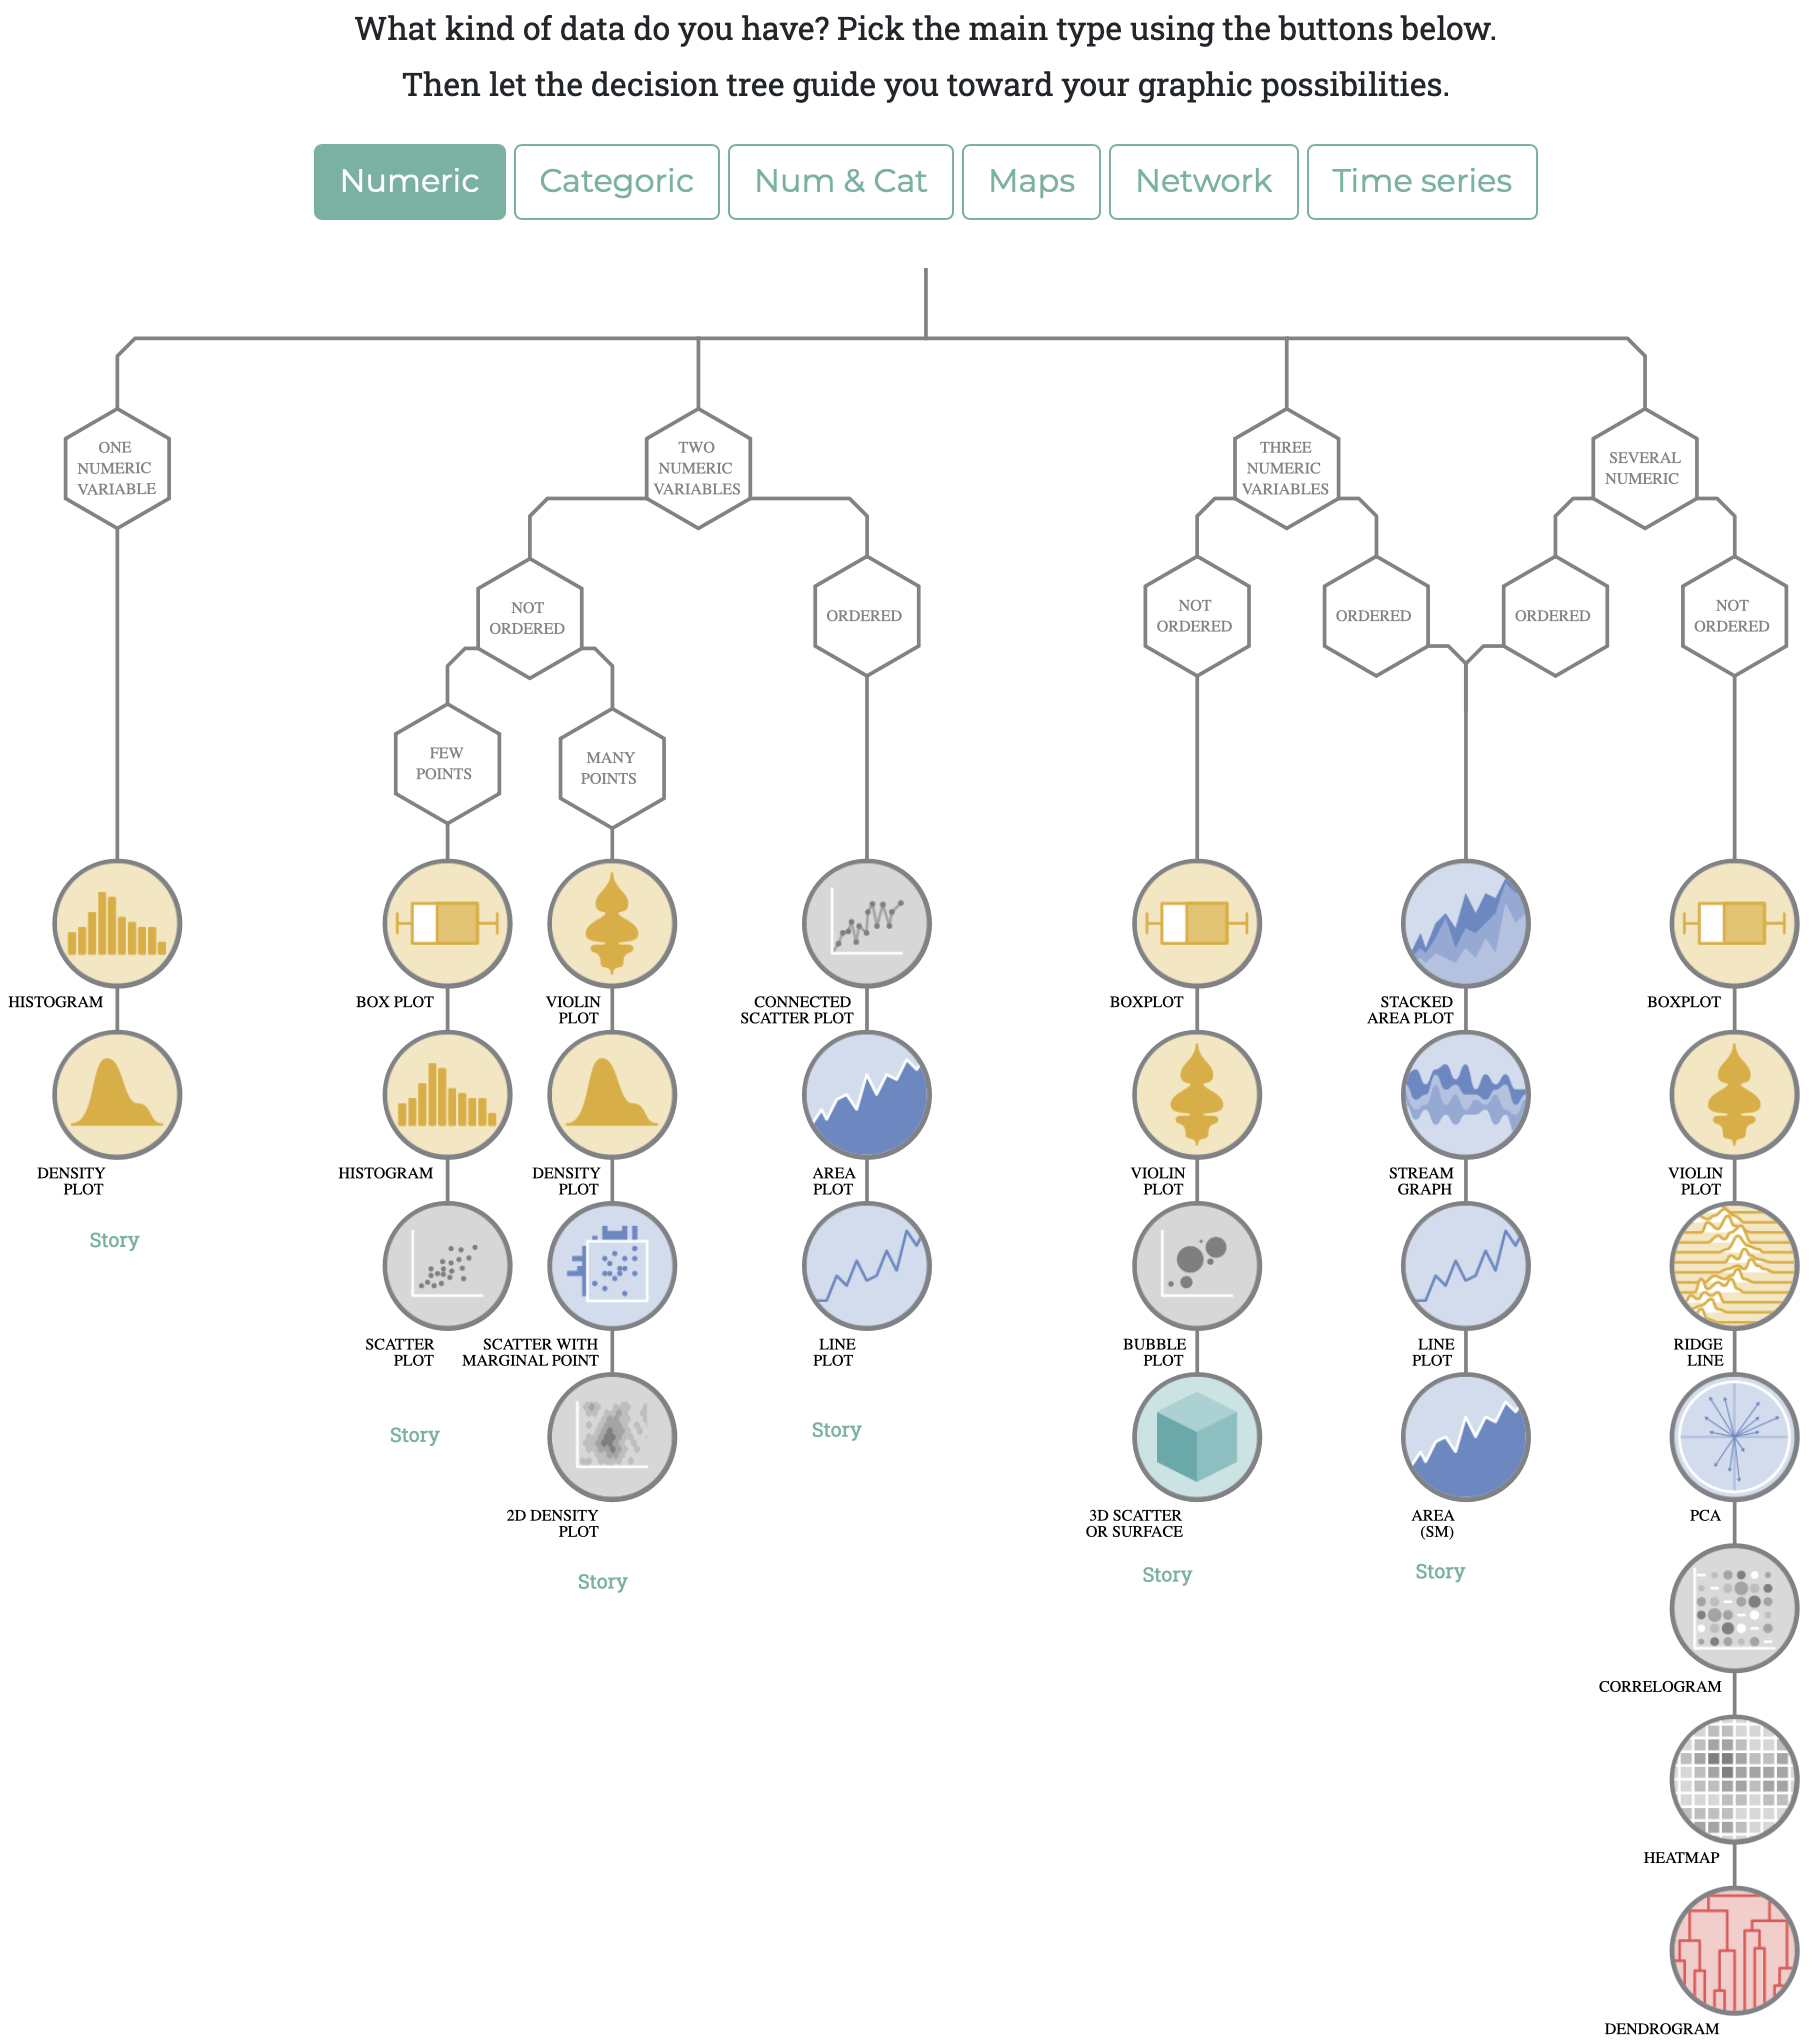
Data-to-Viz: Find the Right Viz
WTF Viz: Examples of what not to do

Atkinson Hyperlegible Font
Free downloadable font for low-vision readers by the Braille Institute used throughout this presentation.
Contact
Jorge Martinez
University of Houston
Director of Research and Reporting
Enrollment Services